> ## Documentation Index
> Fetch the complete documentation index at: https://orgo.space/docs/llms.txt
> Use this file to discover all available pages before exploring further.
# Event Analytics
> Counted attendance, capacity, RSVP mix and ticket revenue for a single event
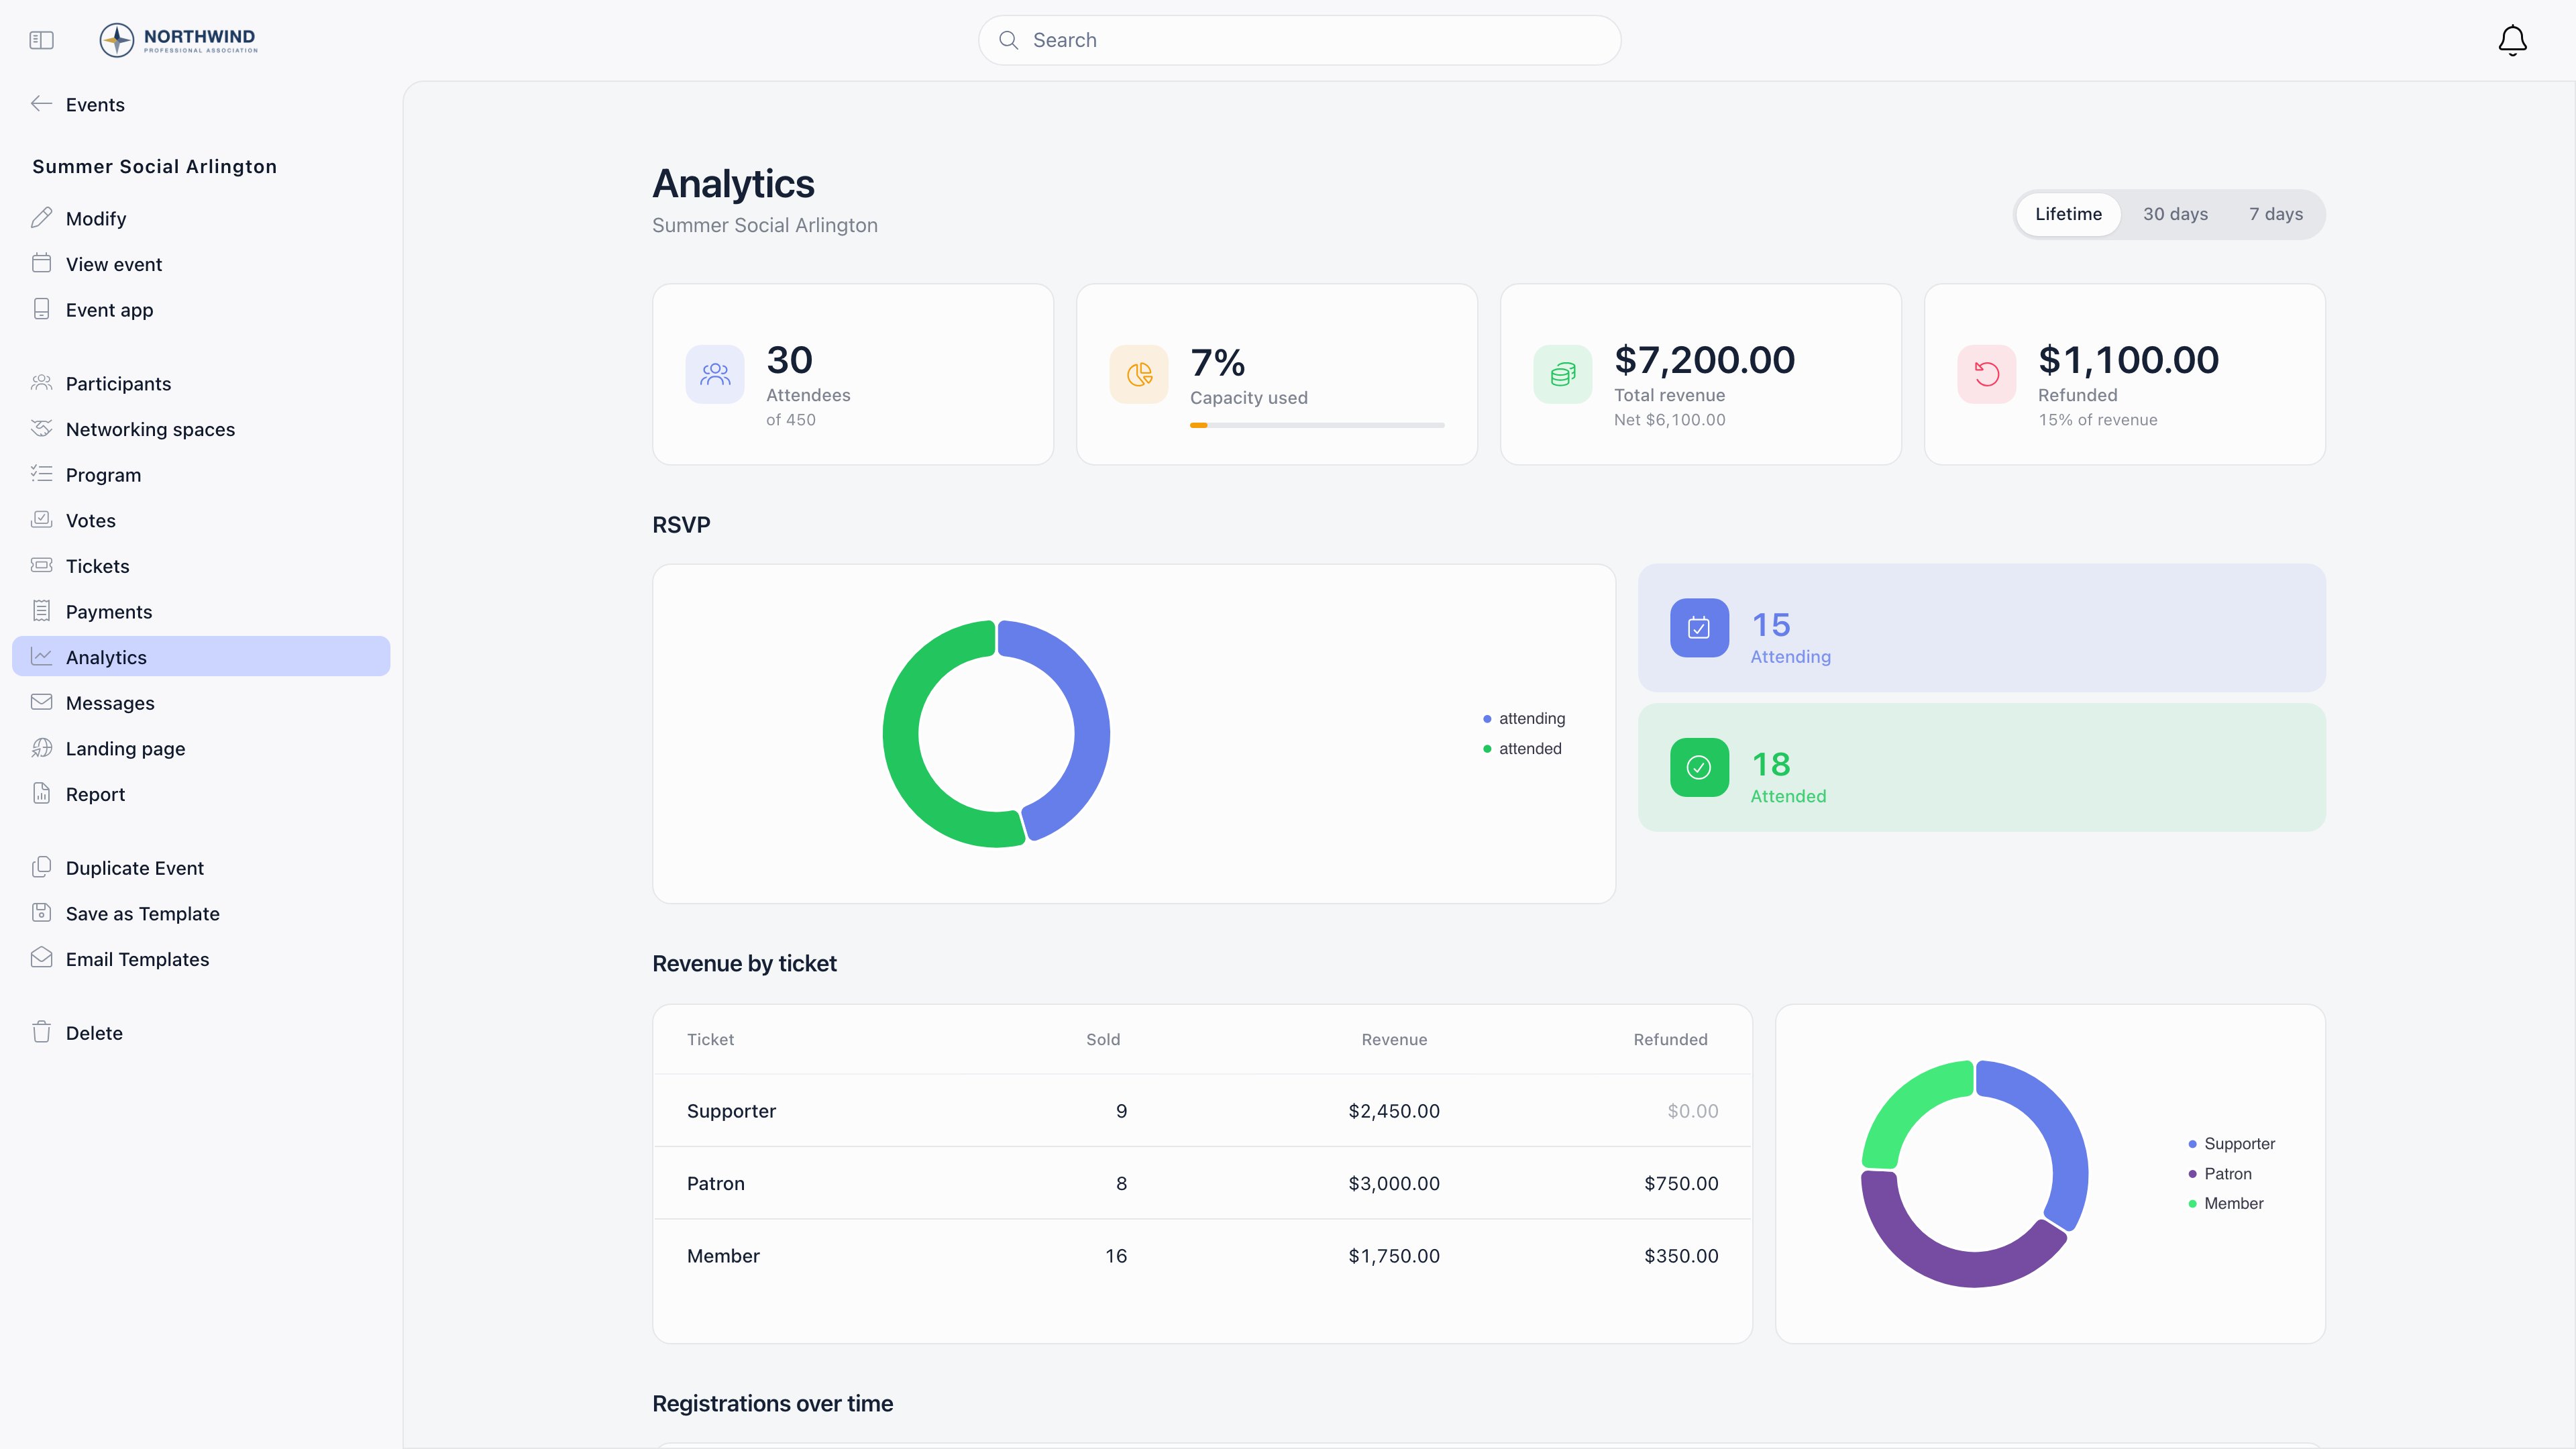
Analytics is the numbers view of one event: how many people are registered, how full it is,
what the RSVPs look like, what each ticket tier has sold, and how registrations arrived over
time. Everything on it is computed from the attendee and payment records, so it needs no
input from the organiser.
 ***
## Opening it
Open the event, then **Analytics** in the event sidebar. No module setting controls it: the
entry is there for every event.
You see it if you can manage the event, meaning you are the **event owner**, or you hold
**EVENT\_LOCAL** for the event's local centre, or **EVENT\_TENANT** organisation-wide.
`ADMIN_TENANT` covers all of these. Ordinary members have no analytics entry, and the
underlying request is refused for anyone outside those roles or from another organisation.
***
## The period selector
Three choices sit in the page header: **Lifetime**, **30 days** and **7 days**.
The window applies to when people registered, not when the event runs. **30 days** means
registrations created in the last 30 days, and every figure on the page (attendees, revenue,
RSVP mix, ticket sales, timeline) is recalculated for that slice. **Lifetime** is the whole
history of the event and is what loads by default.
***
## The four tiles
| Tile | What it counts |
| ----------------- | --------------------------------------------------------------------------------------------------------------------------------------------------------------------------------------------------------- |
| **Attendees** | Registrations that are not cancelled. Rows attached to another registration, such as a guest or an attendee created by an add-on, are not counted separately. Shows "of N" when the event has a capacity. |
| **Capacity used** | Attendees divided by the event's maximum capacity. Shows a dash and **Not set** when no capacity is defined, which is different from 0%. |
| **Total revenue** | Successful ticket payments, before refunds. When there are refunds it also shows the net figure. |
| **Refunded** | Refunded ticket payments, with the share of gross revenue underneath. |
**Attendees** counts every registration status except cancelled, so people who are only **Invited** or
on the **Waiting list** are in the figure. Capacity is enforced against **Registered** alone, which
means **Capacity used** can reach 100% while the event is still accepting sign-ups. Read it as "how
many rows exist", not "how full the room is".
The **Attendees** tile excludes cancellations by registration status while the RSVP donut, the
**Sold** column and the timeline exclude them by cancellation timestamp, so a registration cancelled
through one signal and not the other appears in one section and not the other.
***
## RSVP
A donut with a coloured tile per response: **attending**, **maybe**, **attended** and
**not attending**. Responses with no one in them are left out rather than shown as zero.
The RSVP figures cover registrations that have not been cancelled, again excluding guest and
add-on rows attached to another registration. Someone who registered,
answered "attending" and later cancelled disappears from this section, while their money, if
any, stays in the revenue figures until it is actually refunded.
***
## Revenue by ticket
***
## Opening it
Open the event, then **Analytics** in the event sidebar. No module setting controls it: the
entry is there for every event.
You see it if you can manage the event, meaning you are the **event owner**, or you hold
**EVENT\_LOCAL** for the event's local centre, or **EVENT\_TENANT** organisation-wide.
`ADMIN_TENANT` covers all of these. Ordinary members have no analytics entry, and the
underlying request is refused for anyone outside those roles or from another organisation.
***
## The period selector
Three choices sit in the page header: **Lifetime**, **30 days** and **7 days**.
The window applies to when people registered, not when the event runs. **30 days** means
registrations created in the last 30 days, and every figure on the page (attendees, revenue,
RSVP mix, ticket sales, timeline) is recalculated for that slice. **Lifetime** is the whole
history of the event and is what loads by default.
***
## The four tiles
| Tile | What it counts |
| ----------------- | --------------------------------------------------------------------------------------------------------------------------------------------------------------------------------------------------------- |
| **Attendees** | Registrations that are not cancelled. Rows attached to another registration, such as a guest or an attendee created by an add-on, are not counted separately. Shows "of N" when the event has a capacity. |
| **Capacity used** | Attendees divided by the event's maximum capacity. Shows a dash and **Not set** when no capacity is defined, which is different from 0%. |
| **Total revenue** | Successful ticket payments, before refunds. When there are refunds it also shows the net figure. |
| **Refunded** | Refunded ticket payments, with the share of gross revenue underneath. |
**Attendees** counts every registration status except cancelled, so people who are only **Invited** or
on the **Waiting list** are in the figure. Capacity is enforced against **Registered** alone, which
means **Capacity used** can reach 100% while the event is still accepting sign-ups. Read it as "how
many rows exist", not "how full the room is".
The **Attendees** tile excludes cancellations by registration status while the RSVP donut, the
**Sold** column and the timeline exclude them by cancellation timestamp, so a registration cancelled
through one signal and not the other appears in one section and not the other.
***
## RSVP
A donut with a coloured tile per response: **attending**, **maybe**, **attended** and
**not attending**. Responses with no one in them are left out rather than shown as zero.
The RSVP figures cover registrations that have not been cancelled, again excluding guest and
add-on rows attached to another registration. Someone who registered,
answered "attending" and later cancelled disappears from this section, while their money, if
any, stays in the revenue figures until it is actually refunded.
***
## Revenue by ticket
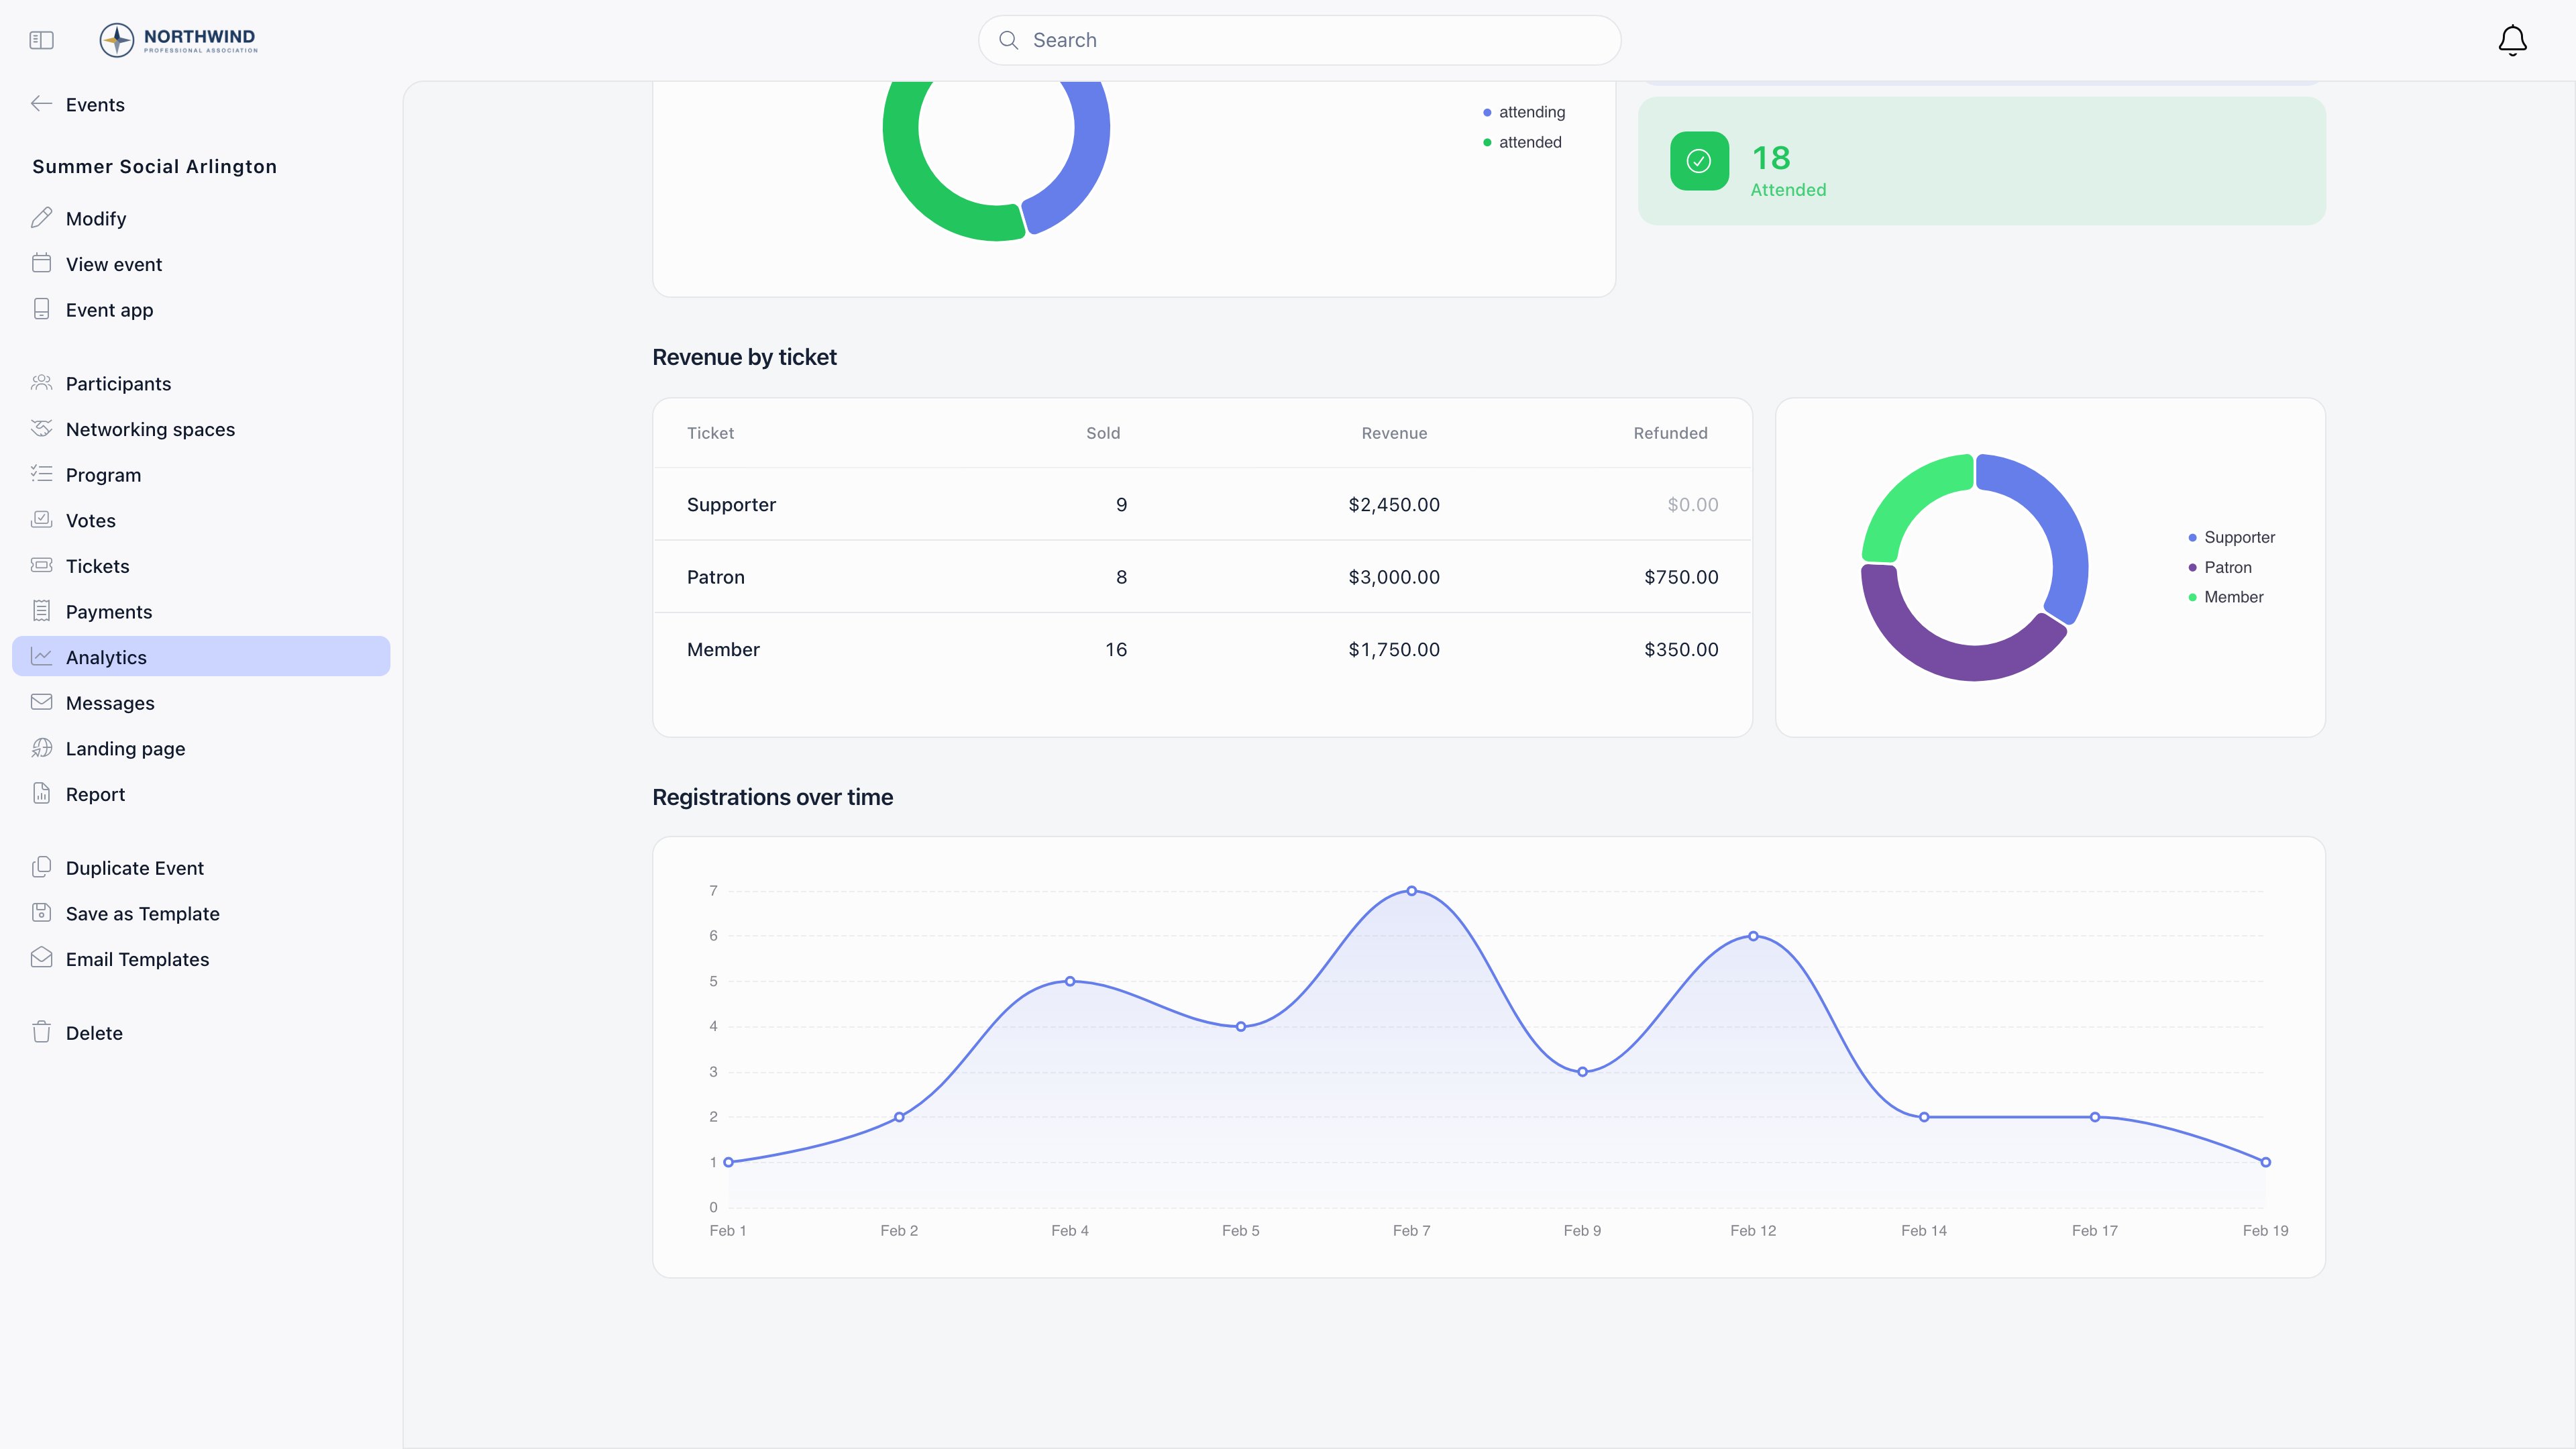 This section appears only when the event has ticketing enabled. It lists one row per ticket
tier with **Ticket**, **Sold**, **Revenue** and **Refunded**, beside a donut showing each
tier's share of gross revenue. Tiers that have taken no money are left out of the donut but
stay in the table.
Attendees who are not attached to a ticket tier, such as people added by an organiser, are
grouped into a single **Unspecified** row.
Two counting rules are worth knowing, because they make the columns disagree in a way that
is deliberate:
* **Sold** counts registrations that are not cancelled.
* **Revenue** and **Refunded** follow the money instead. A cancelled registration whose
payment was never refunded still contributes to revenue, because the money is still in the
account, and a refund tied to a cancelled registration still appears under Refunded.
***
## Registrations over time
A daily line of new registrations, by the date the registration was created, excluding
cancelled ones. It is the quickest way to see whether an announcement, a newsletter or a
deadline moved sign-ups. Individual points are marked while the series has fewer than 30
days of data, and the line is smoothed once it grows past that.
***
## How current the numbers are
**Lifetime** figures are served from a stored summary that is recomputed in the background
whenever something relevant changes: a registration is added, cancelled or moved to another
ticket, or a payment is created, refunded or changes amount. Bulk operations such as an
import or a batch cancellation trigger one recompute for the event rather than one per row.
A nightly job (`app:event-analytics:refresh-stale`) recomputes any summary older than 24
hours, so a missed update corrects itself within a day. Capacity is always read live from the
event, so changing the maximum capacity moves the **Capacity used** tile immediately.
The **30 days** and **7 days** views skip the stored summary entirely and are computed on
request, so they are always current.
If the page shows "No analytics available for this event yet", the event has no attendee
records in the selected window. Switch to **Lifetime** before concluding anything is wrong.
***
## What this page is not
* **There is no export button here.** To get the underlying rows, use the attendee export on
the [participants screen](/docs/platform/events/attendance), which produces a CSV with names,
contact details, ticket type, price, statuses and custom field answers.
* **There is no comparison across events** and no organisation-wide roll-up. Each page covers
one event.
* **It does not replace the written report.** Goals, activities and budget live in the
[event report](/docs/platform/events/event-report).
***
## Related
* [Attendance](/docs/platform/events/attendance): participant records, statuses and the CSV export
* [Ticketing](/docs/platform/events/ticketing): ticket tiers, capacity and refunds
* [Event Reports](/docs/platform/events/event-report): the written record of an event
* [Annual Report](/docs/platform/events/annual-report): compiling reports for a local centre
* [Permissions](/docs/platform/permissions): who holds event permission
This section appears only when the event has ticketing enabled. It lists one row per ticket
tier with **Ticket**, **Sold**, **Revenue** and **Refunded**, beside a donut showing each
tier's share of gross revenue. Tiers that have taken no money are left out of the donut but
stay in the table.
Attendees who are not attached to a ticket tier, such as people added by an organiser, are
grouped into a single **Unspecified** row.
Two counting rules are worth knowing, because they make the columns disagree in a way that
is deliberate:
* **Sold** counts registrations that are not cancelled.
* **Revenue** and **Refunded** follow the money instead. A cancelled registration whose
payment was never refunded still contributes to revenue, because the money is still in the
account, and a refund tied to a cancelled registration still appears under Refunded.
***
## Registrations over time
A daily line of new registrations, by the date the registration was created, excluding
cancelled ones. It is the quickest way to see whether an announcement, a newsletter or a
deadline moved sign-ups. Individual points are marked while the series has fewer than 30
days of data, and the line is smoothed once it grows past that.
***
## How current the numbers are
**Lifetime** figures are served from a stored summary that is recomputed in the background
whenever something relevant changes: a registration is added, cancelled or moved to another
ticket, or a payment is created, refunded or changes amount. Bulk operations such as an
import or a batch cancellation trigger one recompute for the event rather than one per row.
A nightly job (`app:event-analytics:refresh-stale`) recomputes any summary older than 24
hours, so a missed update corrects itself within a day. Capacity is always read live from the
event, so changing the maximum capacity moves the **Capacity used** tile immediately.
The **30 days** and **7 days** views skip the stored summary entirely and are computed on
request, so they are always current.
If the page shows "No analytics available for this event yet", the event has no attendee
records in the selected window. Switch to **Lifetime** before concluding anything is wrong.
***
## What this page is not
* **There is no export button here.** To get the underlying rows, use the attendee export on
the [participants screen](/docs/platform/events/attendance), which produces a CSV with names,
contact details, ticket type, price, statuses and custom field answers.
* **There is no comparison across events** and no organisation-wide roll-up. Each page covers
one event.
* **It does not replace the written report.** Goals, activities and budget live in the
[event report](/docs/platform/events/event-report).
***
## Related
* [Attendance](/docs/platform/events/attendance): participant records, statuses and the CSV export
* [Ticketing](/docs/platform/events/ticketing): ticket tiers, capacity and refunds
* [Event Reports](/docs/platform/events/event-report): the written record of an event
* [Annual Report](/docs/platform/events/annual-report): compiling reports for a local centre
* [Permissions](/docs/platform/permissions): who holds event permission