> ## Documentation Index
> Fetch the complete documentation index at: https://orgo.space/docs/llms.txt
> Use this file to discover all available pages before exploring further.
# Event Reports
> Document completed events with photos, attendance stats, and outcomes
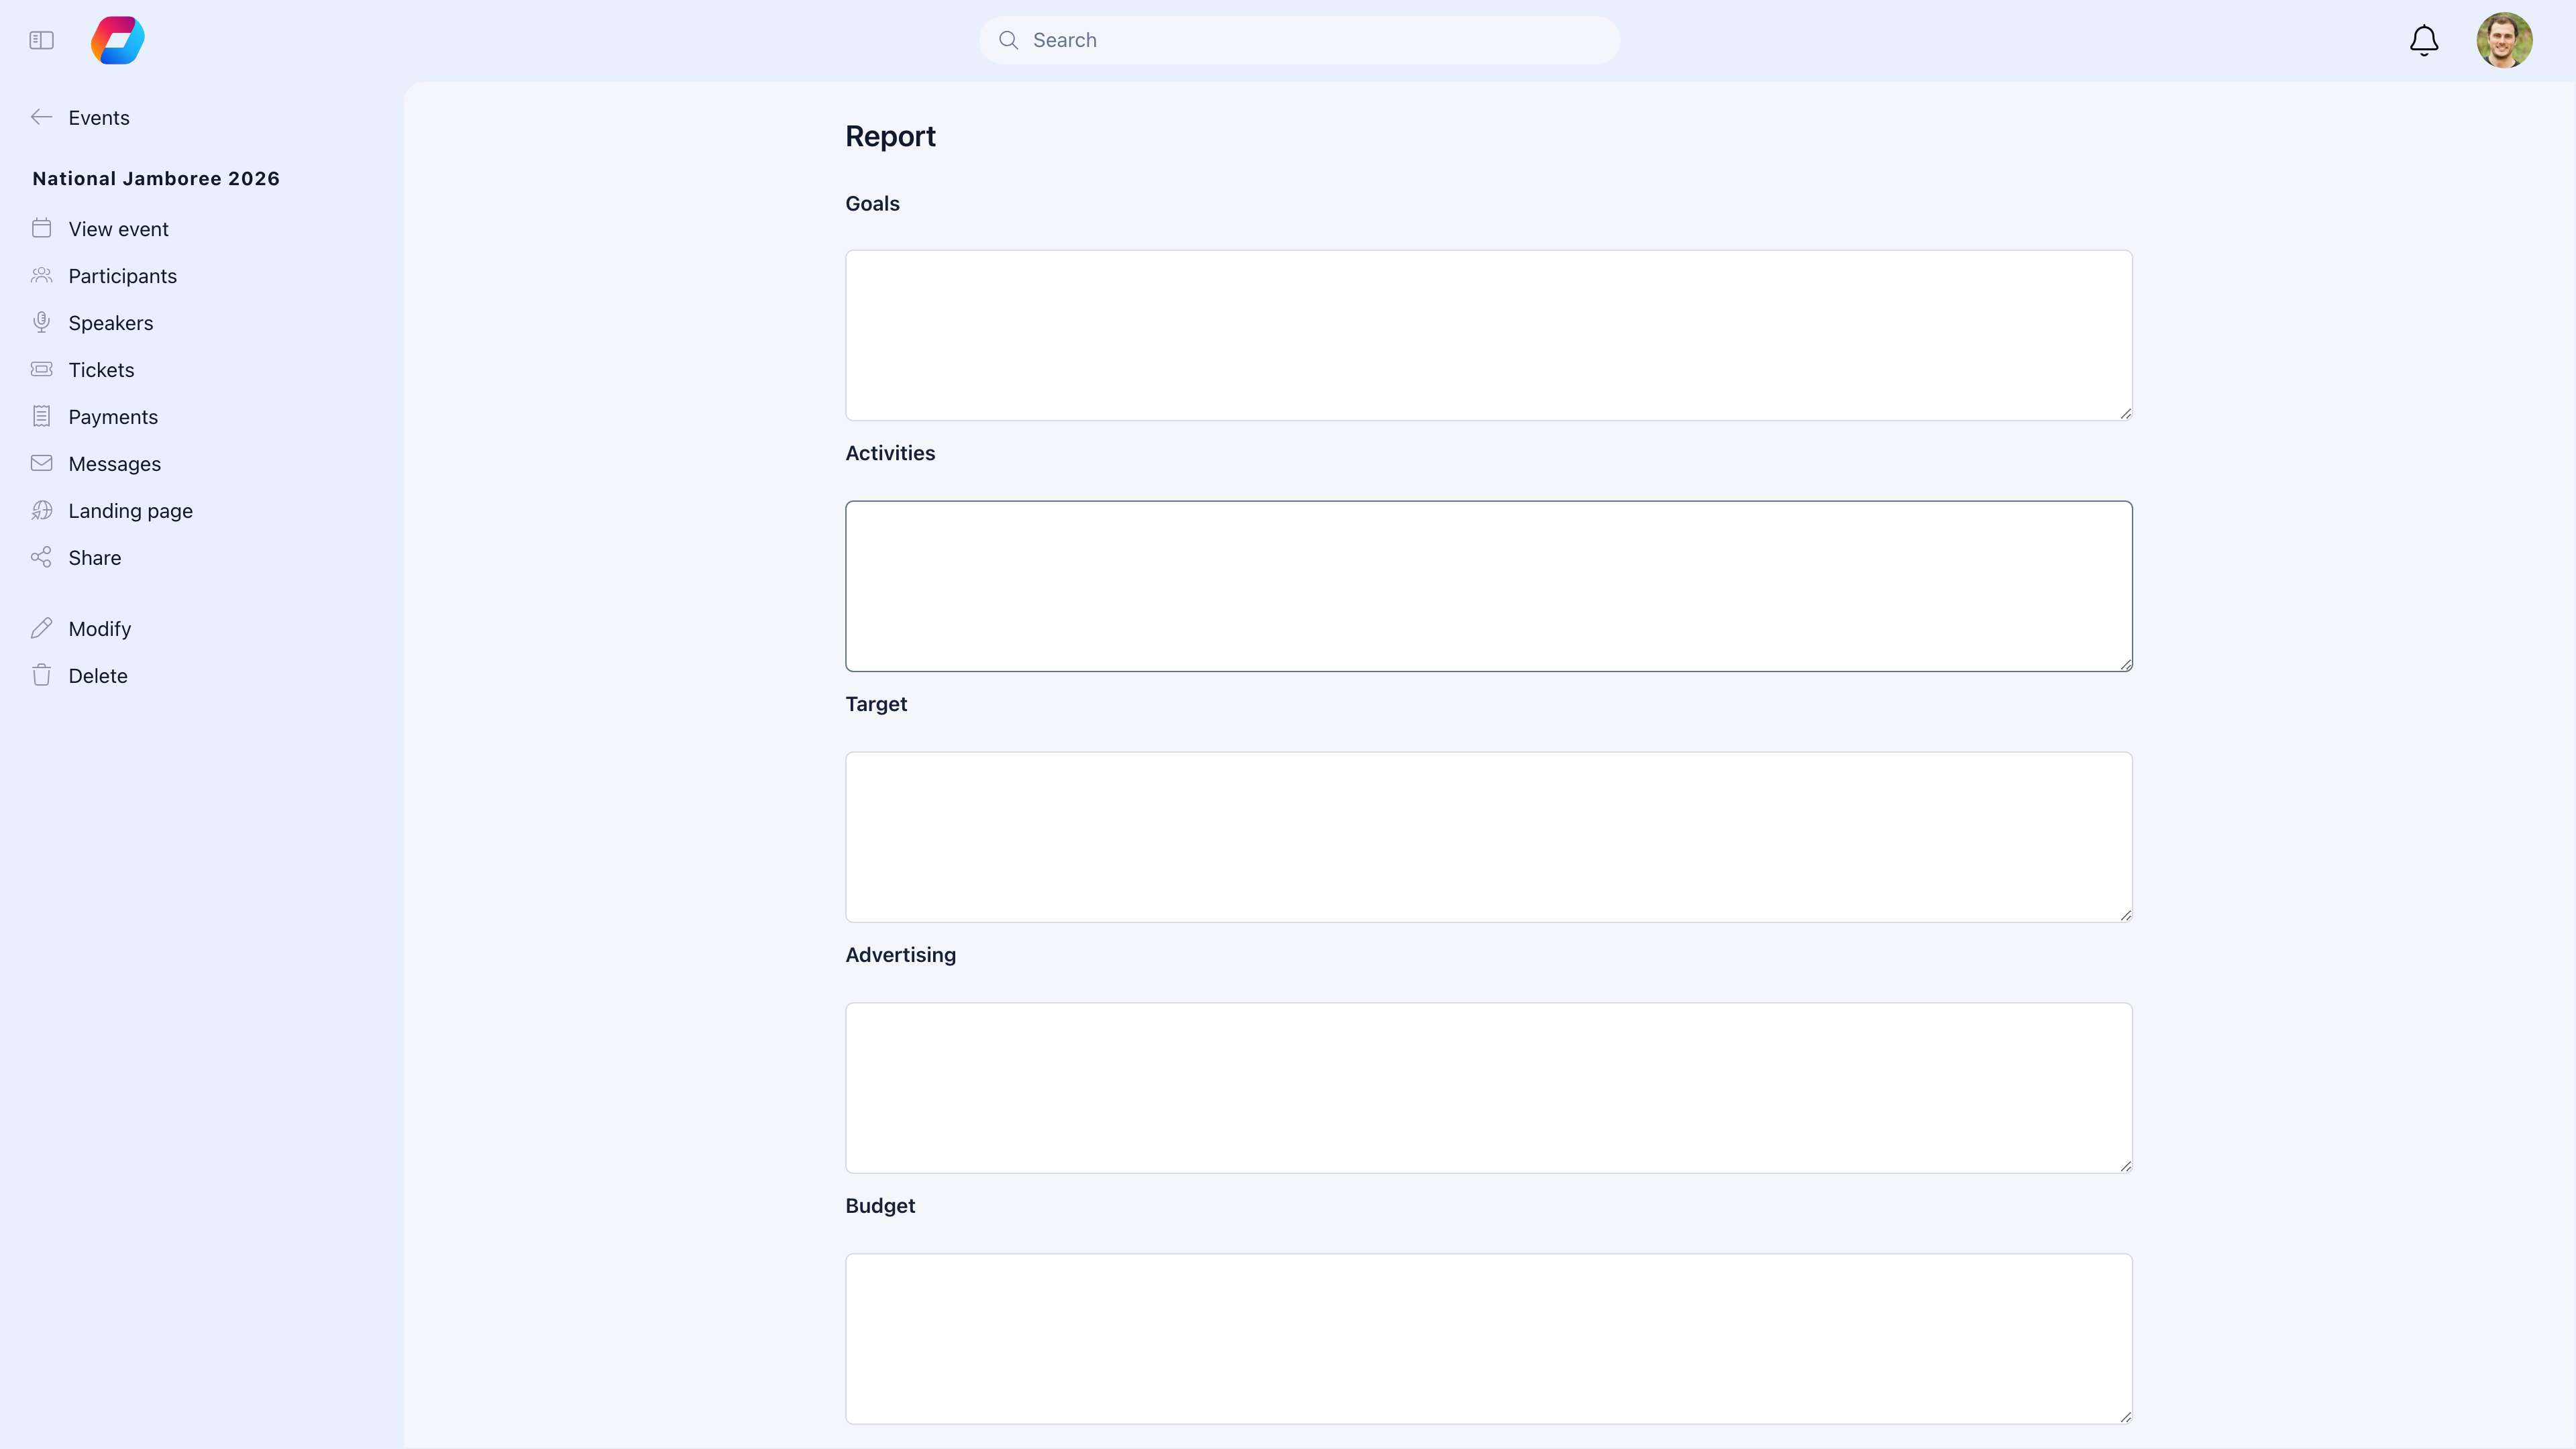
Event Reports are post-event summaries that capture what happened: how many people came, what was achieved, photos, and outcomes. They serve as organizational memory and feed into [Annual Reports](/platform/events/annual-report) for year-end statistics.
 ***
## Why create event reports?
| Purpose | How it helps |
| -------------------------- | --------------------------------------------------------------------------------------------------------------------- |
| **Institutional memory** | Six months from now, you can look back and see what happened — who attended, what was decided, what photos were taken |
| **Board/funder reporting** | Prove your impact with concrete numbers and documentation |
| **Future planning** | Review past reports when planning similar events — what worked, what didn't, how many attended |
| **Member engagement** | Members who missed the event can see what happened — photos, summary, outcomes |
| **Annual reporting** | Individual event reports feed automatically into the [Annual Report](/platform/events/annual-report) |
***
## Enable event reports
**Settings** → **Events** → **Module Settings** → enable **Event Reports**
Once enabled, every completed event gets a **Report** tab.
***
## Creating a report
After the event ends, go to the event → **Report** tab.
Review and confirm the attendance numbers. The system pre-fills from check-in data, but you can adjust if needed (e.g., you counted walk-ins who weren't scanned).
Describe what happened — key moments, topics covered, decisions made. Rich text with formatting, links, and inline images.
Add event photos to create a gallery. Drag and drop multiple images at once. These become the event's photo archive.
Document decisions made, action items, follow-up tasks, or results achieved.
If your org tracks volunteer time, record total volunteer hours contributed at this event.
Save as draft for later editing, or publish to make the report visible.
Create reports within a week of the event while details are fresh. The longer you wait, the harder it is to write a useful summary.
***
## What the report includes
| Section | Content |
| -------------------- | ---------------------------------------------------------------------------- |
| **Event details** | Title, date, location, type, organizer — pulled automatically from the event |
| **Attendance stats** | Registrations, actual attendance, attendance rate, no-shows, walk-ins |
| **Summary** | Your written description of what happened |
| **Outcomes** | Decisions, results, follow-up actions |
| **Photos** | Event gallery |
| **Volunteer hours** | Total volunteer hours contributed |
| **SDG alignment** | If SDG tagging is enabled — impact tracking |
***
## Attendance verification
The report shows attendance metrics calculated from your check-in data:
| Metric | How it's calculated |
| ------------------- | ------------------------------------- |
| **Registrations** | Total people who signed up |
| **Checked in** | Marked as attended (via QR or manual) |
| **No shows** | Registered but not checked in |
| **Walk-ins** | Attended without pre-registration |
| **Attendance rate** | Checked in ÷ Registered |
If you didn't check people in during the event, go to the participant list first, mark who attended, then create the report — the numbers will update.
***
## Photo gallery
### Adding photos
* Click "Add Photos" in the report
* Select multiple images at once (drag and drop supported)
* Images are compressed automatically for web viewing
* Add captions to individual photos if helpful
### Photo guidelines
* Include variety: setup, activities, group shots, candids, speakers
* Choose your best 10-20 photos, not every photo taken
* Feature diverse participants
Get photo consent from participants, especially for events with minors. Consider adding a photo release clause to your event registration form.
***
## Draft vs. published
| State | Who can see it |
| ------------- | ----------------------------------------------------------------------- |
| **Draft** | Only event organizers and admins — work on it until it's ready |
| **Published** | Visible to members (for private events) or publicly (for public events) |
***
## Common scenarios
Yes. Any admin with event management permissions can create or edit event reports. Gently remind hosts about reporting — enabling **attendance reminders** in module settings helps.
Screenshot key moments from the webinar or virtual event — the speaker presenting, the Q\&A chat, attendance numbers. Many video conferencing tools let you capture screenshots during the session.
It follows the event's visibility setting. Public event → public report. Members-only event → members-only report. Admins can override this.
Yes. Go back to the Report tab and make changes. Updates are reflected immediately.
***
## Related
* [Attendance](/platform/events/attendance) — Check-in data that feeds into reports
* [Annual Report](/platform/events/annual-report) — Yearly aggregation of all event reports
* [Events Overview](/platform/events) — Module setup and configuration
***
## Why create event reports?
| Purpose | How it helps |
| -------------------------- | --------------------------------------------------------------------------------------------------------------------- |
| **Institutional memory** | Six months from now, you can look back and see what happened — who attended, what was decided, what photos were taken |
| **Board/funder reporting** | Prove your impact with concrete numbers and documentation |
| **Future planning** | Review past reports when planning similar events — what worked, what didn't, how many attended |
| **Member engagement** | Members who missed the event can see what happened — photos, summary, outcomes |
| **Annual reporting** | Individual event reports feed automatically into the [Annual Report](/platform/events/annual-report) |
***
## Enable event reports
**Settings** → **Events** → **Module Settings** → enable **Event Reports**
Once enabled, every completed event gets a **Report** tab.
***
## Creating a report
After the event ends, go to the event → **Report** tab.
Review and confirm the attendance numbers. The system pre-fills from check-in data, but you can adjust if needed (e.g., you counted walk-ins who weren't scanned).
Describe what happened — key moments, topics covered, decisions made. Rich text with formatting, links, and inline images.
Add event photos to create a gallery. Drag and drop multiple images at once. These become the event's photo archive.
Document decisions made, action items, follow-up tasks, or results achieved.
If your org tracks volunteer time, record total volunteer hours contributed at this event.
Save as draft for later editing, or publish to make the report visible.
Create reports within a week of the event while details are fresh. The longer you wait, the harder it is to write a useful summary.
***
## What the report includes
| Section | Content |
| -------------------- | ---------------------------------------------------------------------------- |
| **Event details** | Title, date, location, type, organizer — pulled automatically from the event |
| **Attendance stats** | Registrations, actual attendance, attendance rate, no-shows, walk-ins |
| **Summary** | Your written description of what happened |
| **Outcomes** | Decisions, results, follow-up actions |
| **Photos** | Event gallery |
| **Volunteer hours** | Total volunteer hours contributed |
| **SDG alignment** | If SDG tagging is enabled — impact tracking |
***
## Attendance verification
The report shows attendance metrics calculated from your check-in data:
| Metric | How it's calculated |
| ------------------- | ------------------------------------- |
| **Registrations** | Total people who signed up |
| **Checked in** | Marked as attended (via QR or manual) |
| **No shows** | Registered but not checked in |
| **Walk-ins** | Attended without pre-registration |
| **Attendance rate** | Checked in ÷ Registered |
If you didn't check people in during the event, go to the participant list first, mark who attended, then create the report — the numbers will update.
***
## Photo gallery
### Adding photos
* Click "Add Photos" in the report
* Select multiple images at once (drag and drop supported)
* Images are compressed automatically for web viewing
* Add captions to individual photos if helpful
### Photo guidelines
* Include variety: setup, activities, group shots, candids, speakers
* Choose your best 10-20 photos, not every photo taken
* Feature diverse participants
Get photo consent from participants, especially for events with minors. Consider adding a photo release clause to your event registration form.
***
## Draft vs. published
| State | Who can see it |
| ------------- | ----------------------------------------------------------------------- |
| **Draft** | Only event organizers and admins — work on it until it's ready |
| **Published** | Visible to members (for private events) or publicly (for public events) |
***
## Common scenarios
Yes. Any admin with event management permissions can create or edit event reports. Gently remind hosts about reporting — enabling **attendance reminders** in module settings helps.
Screenshot key moments from the webinar or virtual event — the speaker presenting, the Q\&A chat, attendance numbers. Many video conferencing tools let you capture screenshots during the session.
It follows the event's visibility setting. Public event → public report. Members-only event → members-only report. Admins can override this.
Yes. Go back to the Report tab and make changes. Updates are reflected immediately.
***
## Related
* [Attendance](/platform/events/attendance) — Check-in data that feeds into reports
* [Annual Report](/platform/events/annual-report) — Yearly aggregation of all event reports
* [Events Overview](/platform/events) — Module setup and configuration