Analytics that show you the real picture
See what's working. Fix what isn't.
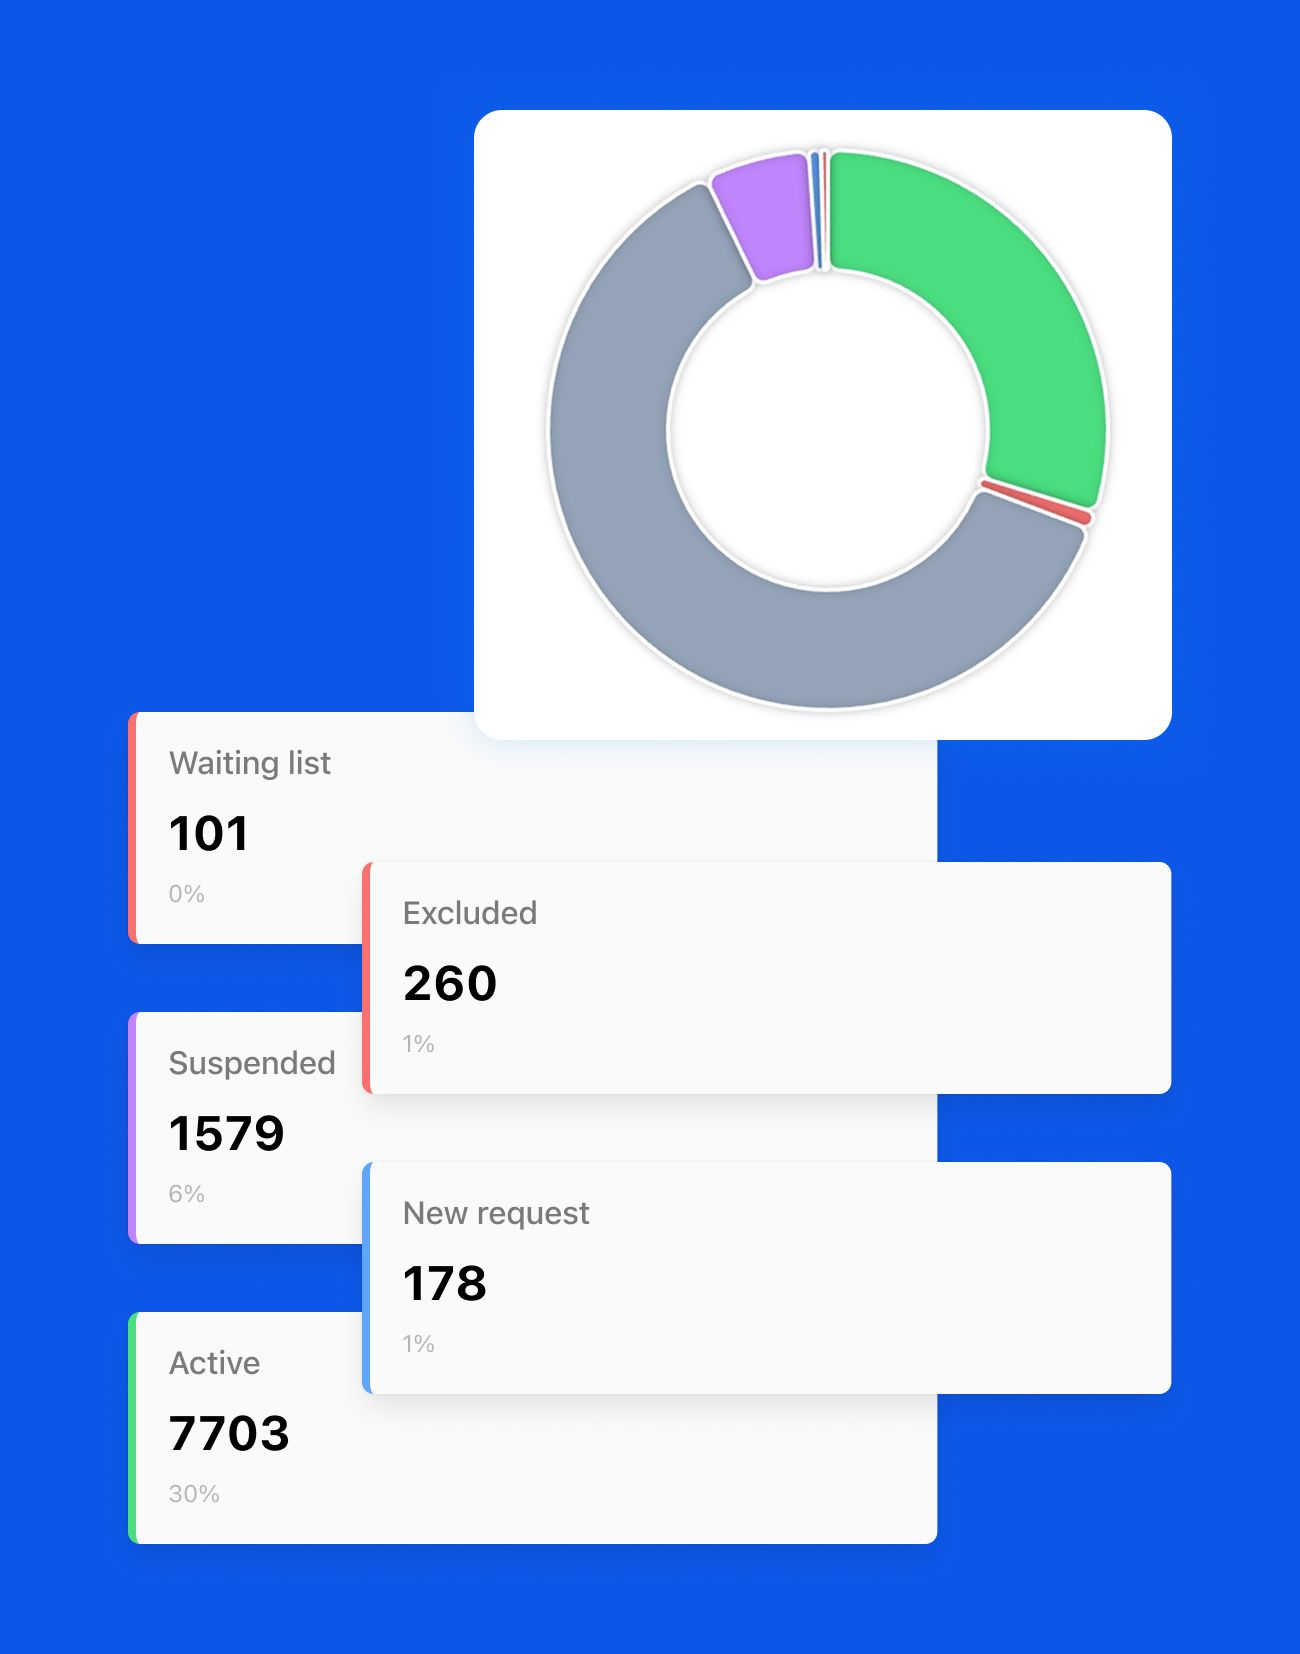
Orgo gives you a configurable dashboard with real numbers on membership, revenue, events, and engagement. No guesswork. You get widgets, custom queries, and CSV exports so you can actually act on the data.
Why organizations track their data with Orgo
Real numbers, not dashboards for show
Your dashboard shows member count, fee payments, revenue, and event attendance. Not vanity metrics. Numbers you can use in your next board meeting.
Segment your members in seconds
Build custom user lists with dynamic filtering. See exactly which members match your criteria. Use this for targeted outreach or just to understand your community better.
Export everything you need
Export users, roles, contacts, event attendance, and vote collections as CSV. Download invoices and adhesion documents as PDF. Get bulk payment data in one click.
Everything your community does, measured
Orgo tracks the data that matters for community organizations. Member growth, fee collection rates, event attendance, newsletter performance, discussion activity. It's all in one place, with widgets you can customize and queries you can build yourself.
Dashboard & widgets
Your dashboard, your layout. Configure it to show what your team needs.
Dashboard categories
Organize your dashboard into categories that match how you think about your organization. Group financial widgets separately from engagement widgets.
Custom widgets
Add, remove, and rearrange widgets. Each widget shows a specific metric or chart. You decide what's visible.
Welcome messages
Set up a welcome message for your team when they log in. Use it for announcements, reminders, or quick status updates.
Custom queries
Write your own queries to pull specific data from your community. Filter by date, member type, local center, or any field that matters to you.
Membership analytics
Know exactly how your membership is growing and who your members are.
Member count & growth
See your total member count and how it changes over time. Track new registrations, active members, and lapsed memberships.
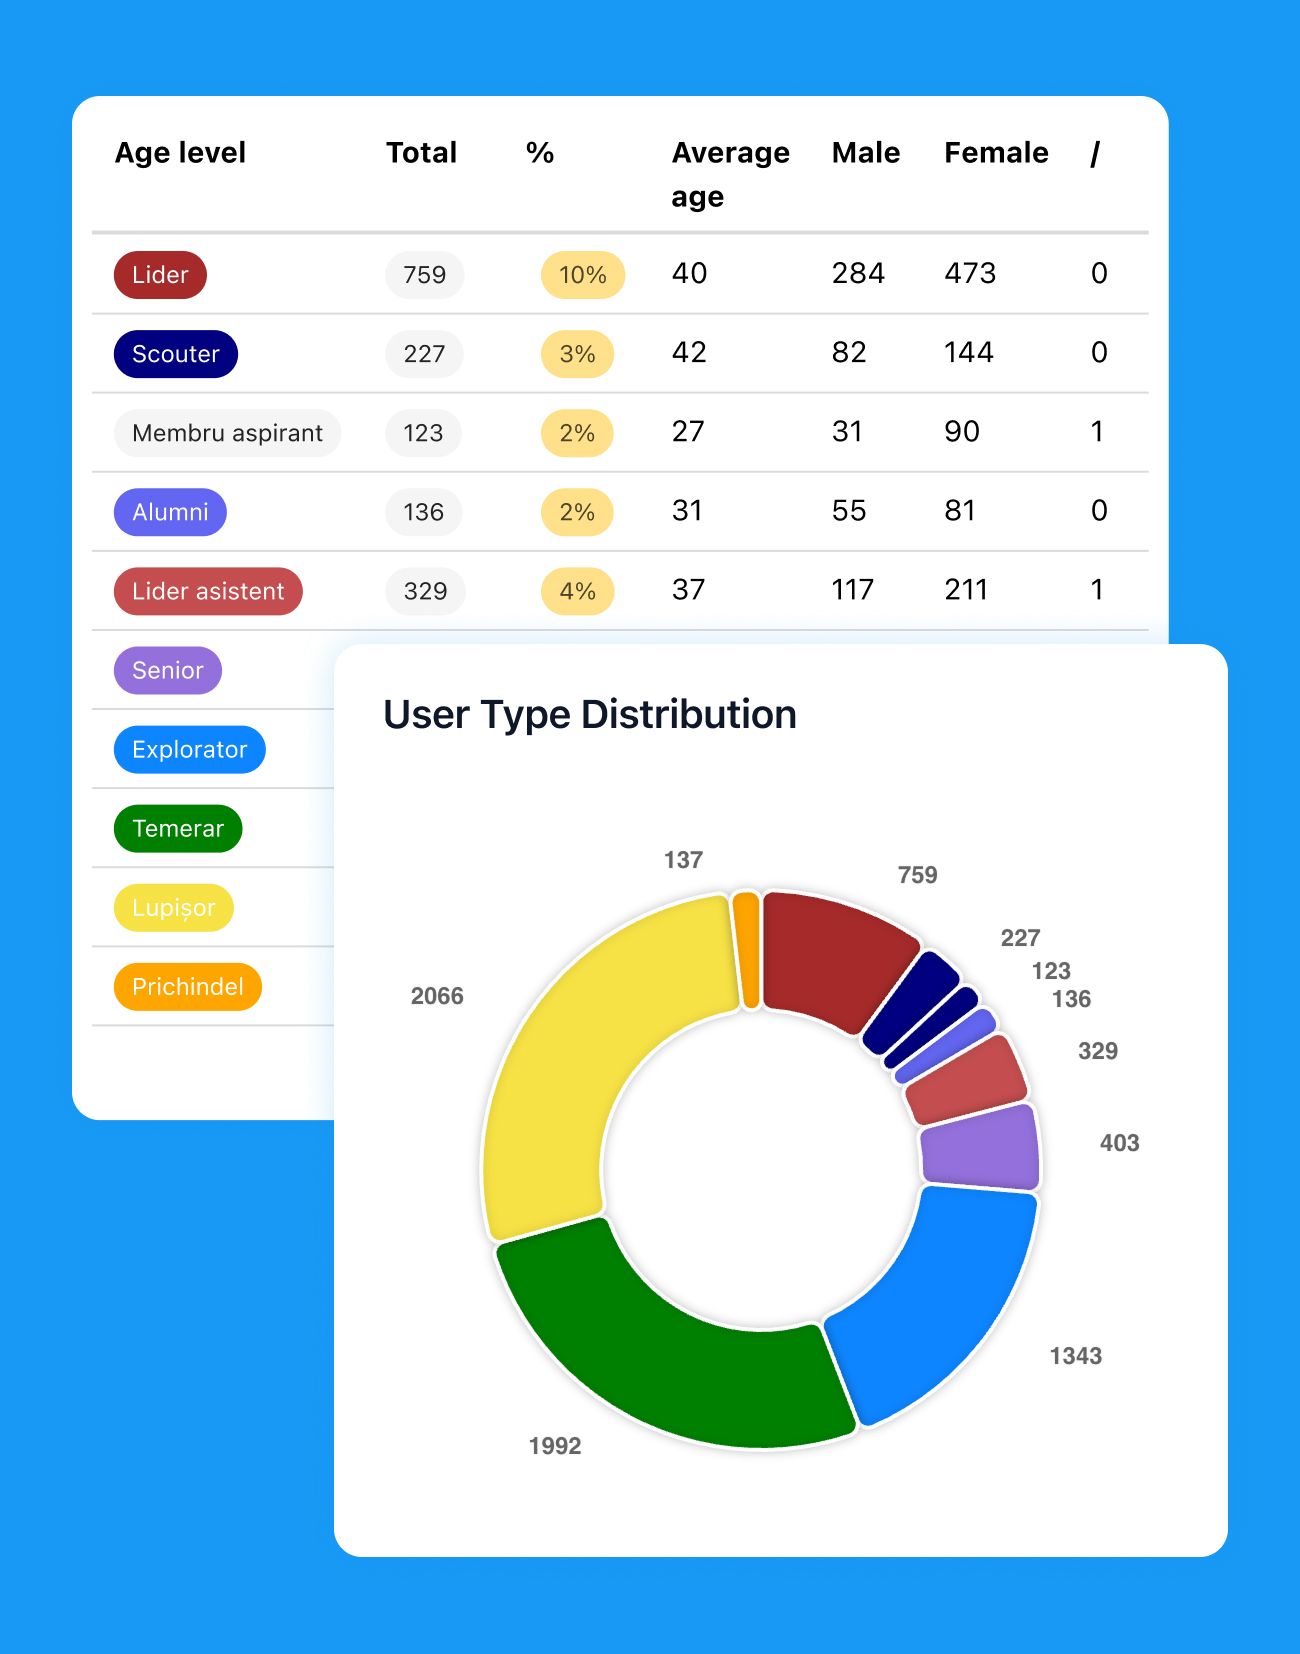
Participant demographics
View member demographics and profile data. Understand who your community is, not just how big it is.
Profile view tracking
Track how often member profiles are viewed. A useful signal for community activity and networking.
Custom user lists
Build custom lists with dynamic filters. Segment members by location, membership type, activity level, or any combination of criteria.
Financial reports
Track fees, revenue, and payments without digging through spreadsheets.
Fee payments by center
See fee payment statistics broken down by local center. Know which chapters are collecting on time and which need follow-up.
Revenue tracking
Track total revenue across membership fees, events, and other income sources. Compare periods to spot trends.
Financial exports
Download invoices as PDF. Get bulk payment data as CSV. Everything you need for accounting is exportable.
Revenue by segment
See which membership tiers and fee structures generate the most income. Useful when reviewing your pricing.
Event & engagement data
Events, newsletters, discussions, badges. All the engagement data in one view.
Event attendance
See how many people attend each event. Compare attendance across event types and time periods.
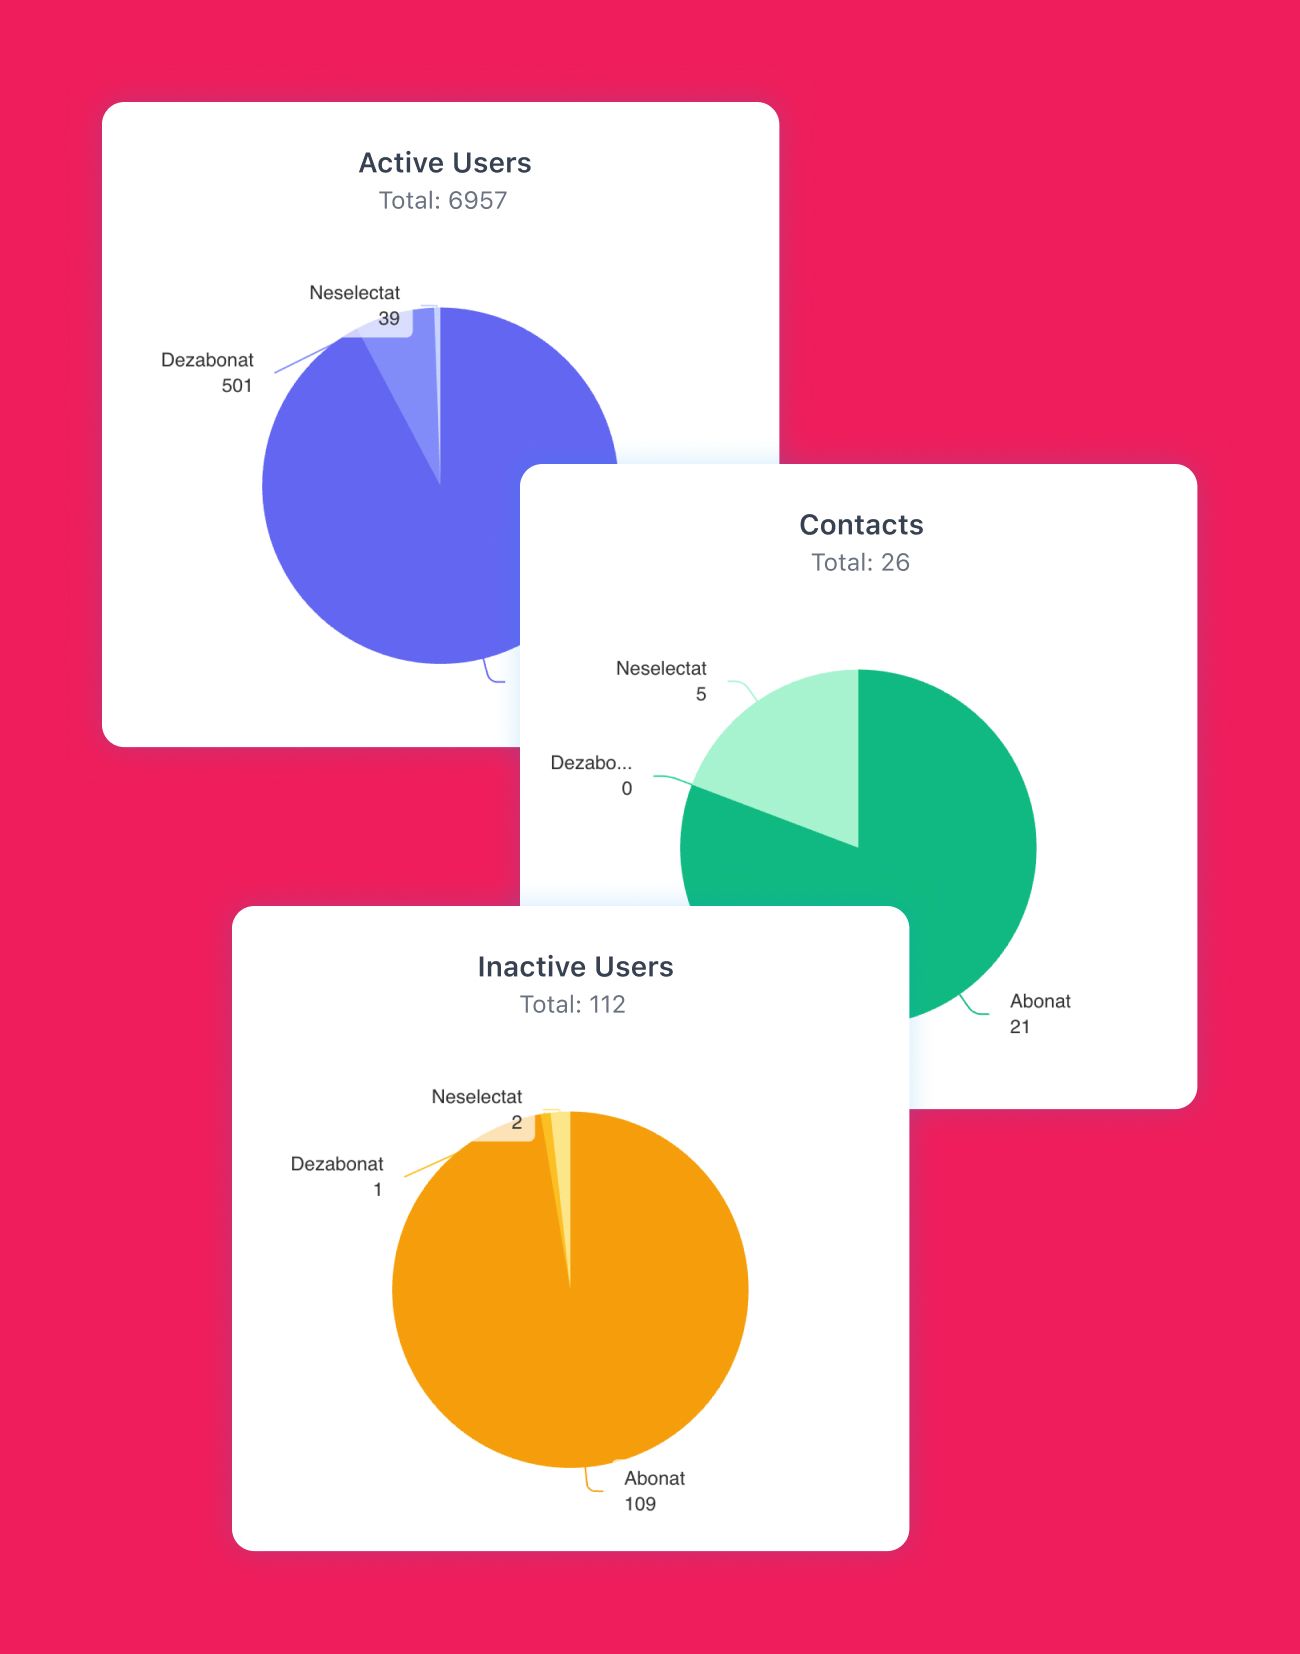
Newsletter analytics
Track open rates, click-through rates, and bounces for your newsletters. Know which emails people actually read.
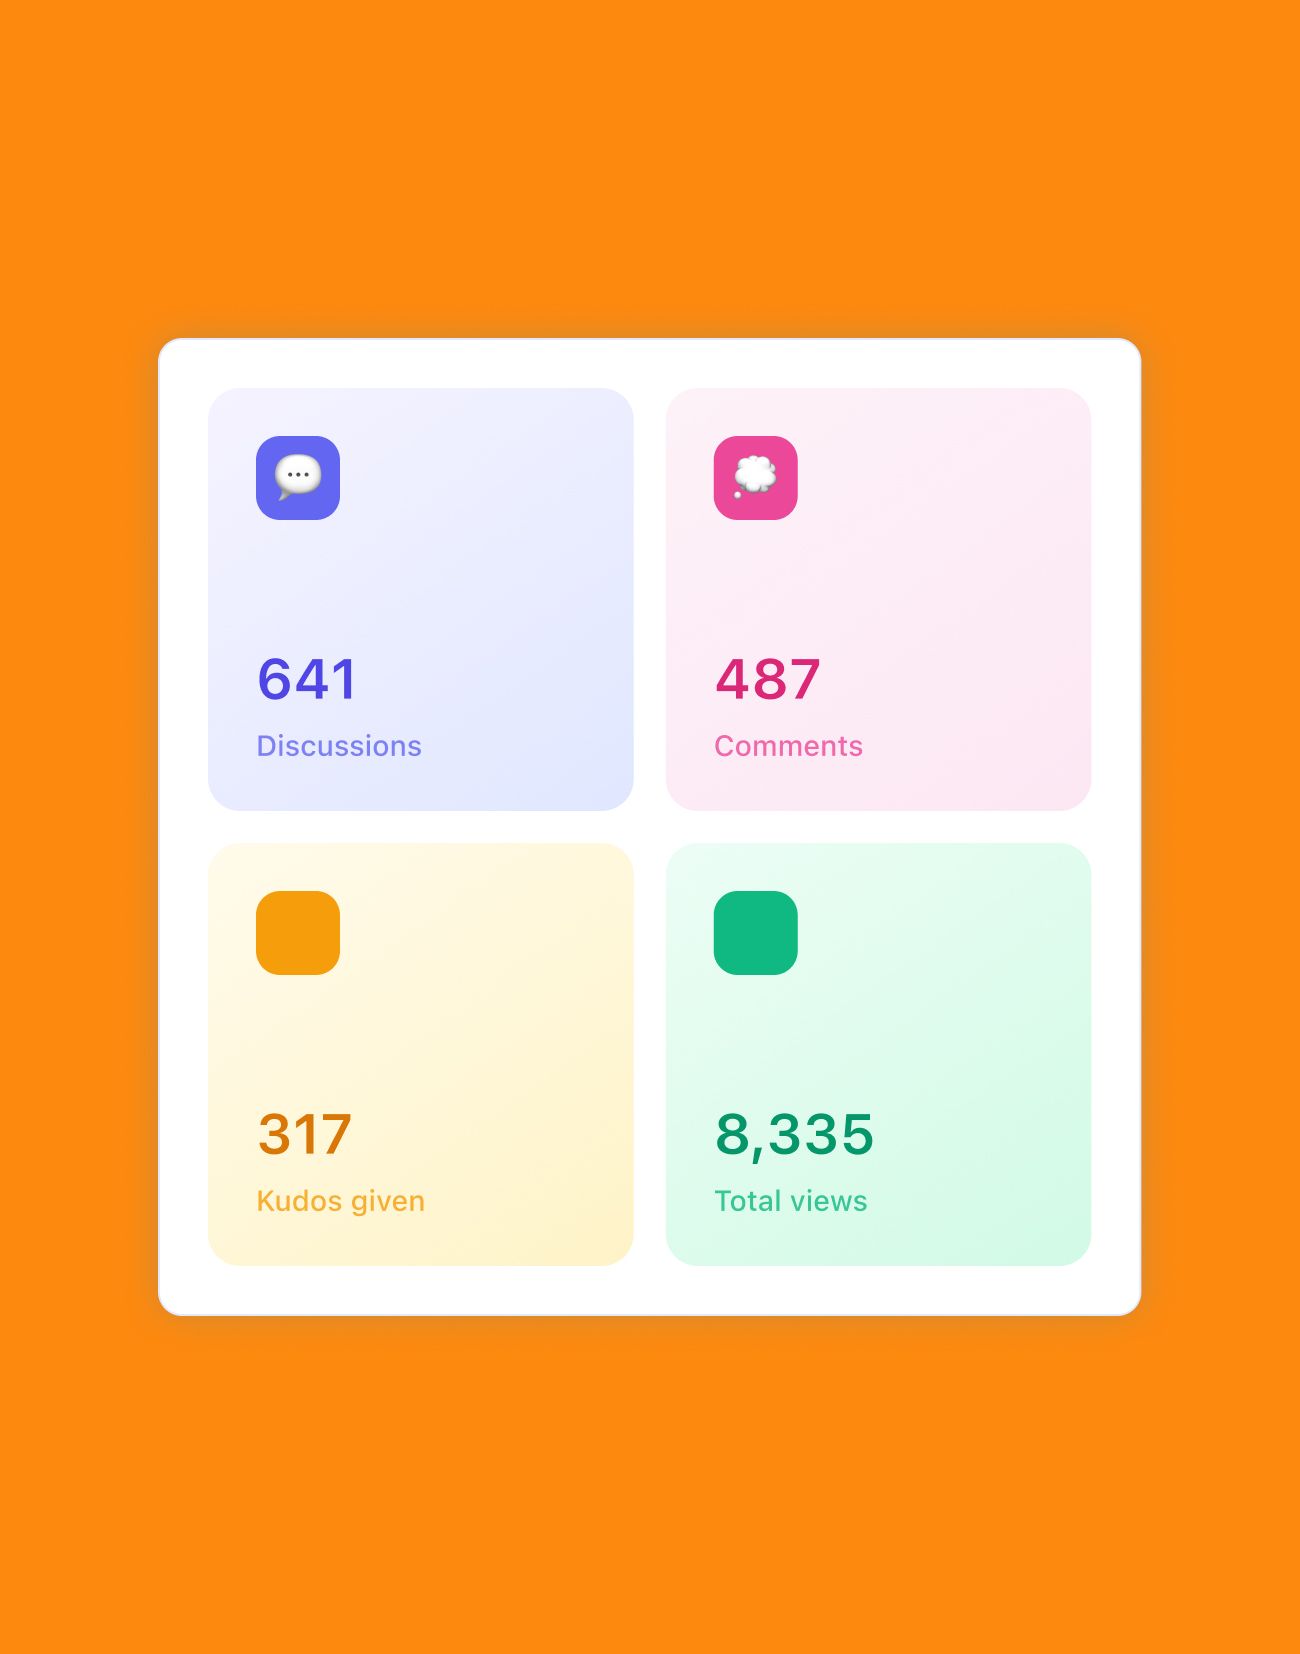
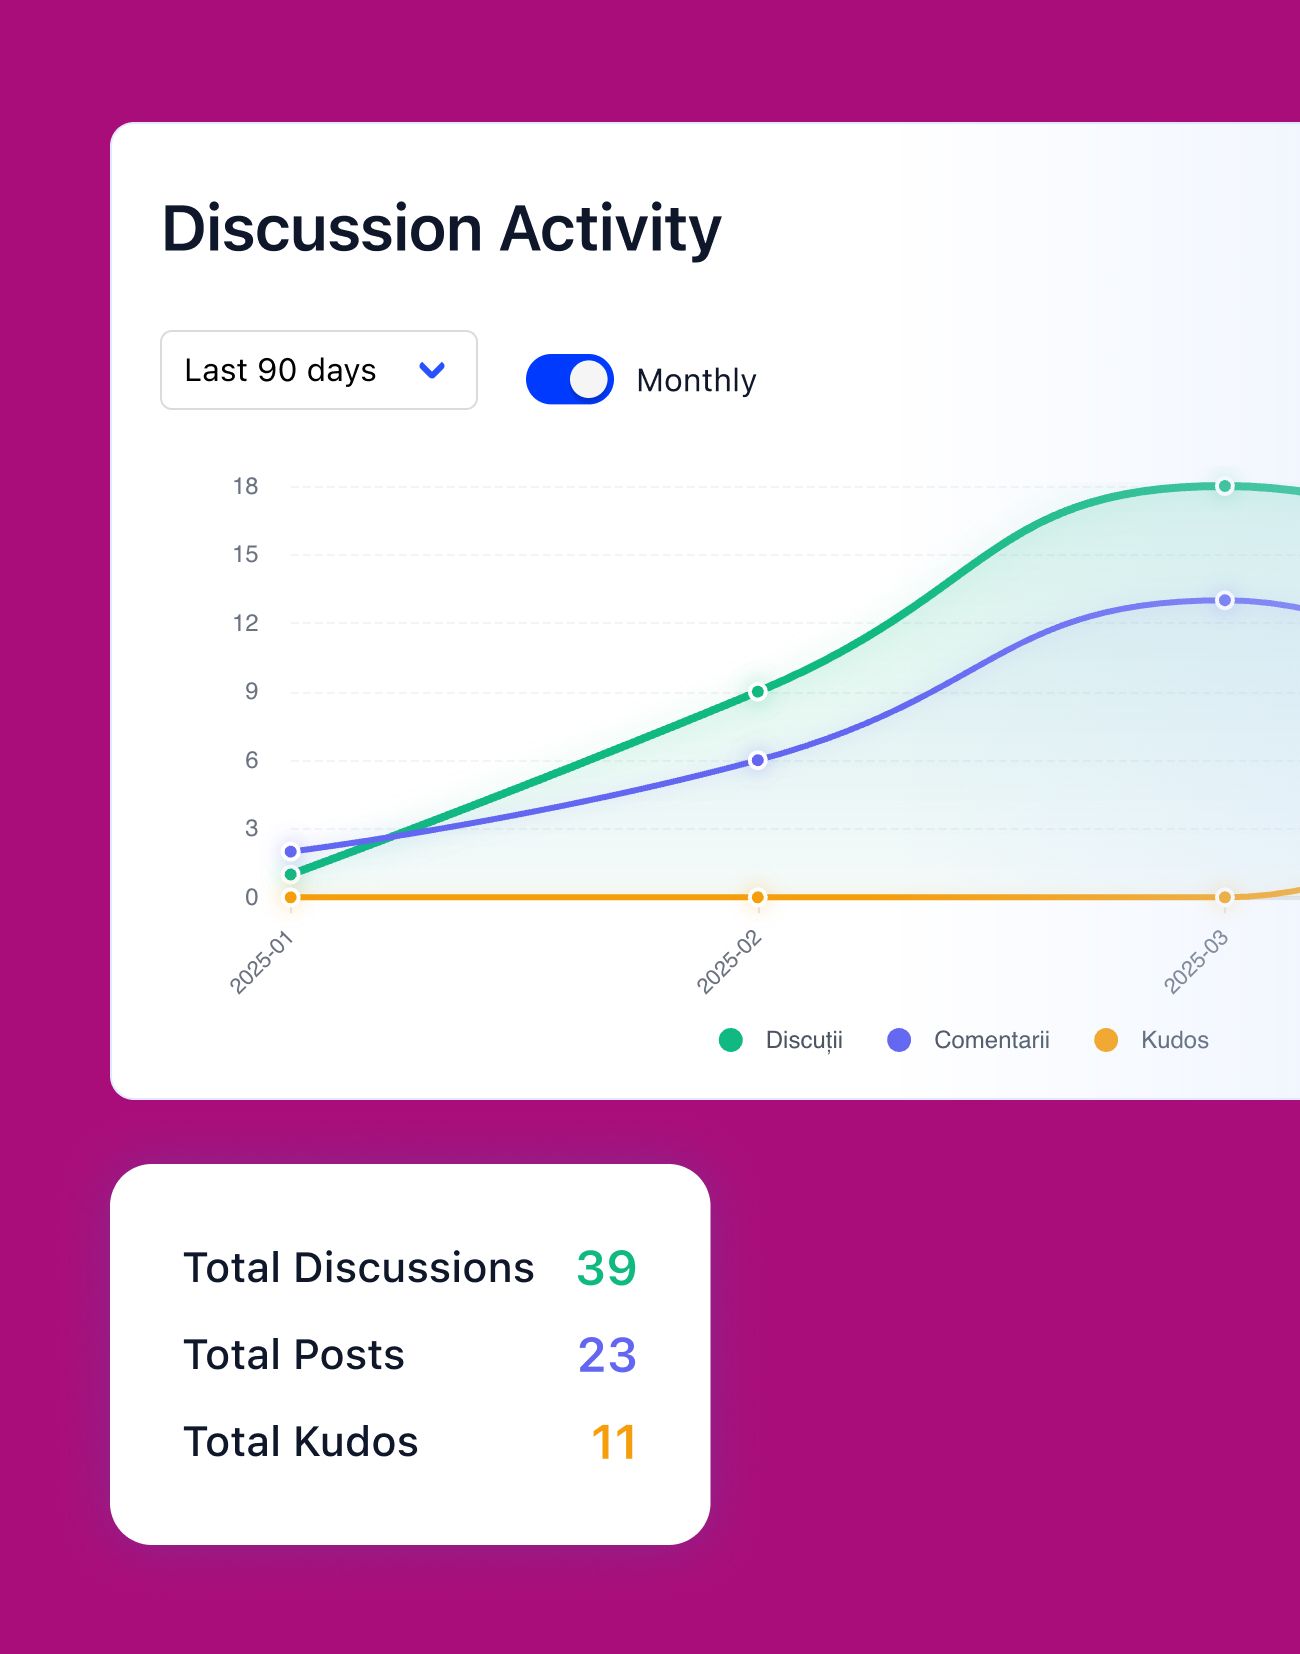
Discussion engagement
See which discussions get the most replies and reactions. Understand what topics your community cares about.
Badge leaderboards
View badge leaderboards and gamification stats. See who's most active and which achievements drive participation.
Data exports
CSV and PDF exports for everything. Your data is always accessible.
User & contact CSV
Export your user list, roles, and contact information as CSV. Use it for mail merges, external tools, or backup.
Event attendance CSV
Download event attendance data as CSV. See who showed up, filter by event, and track participation over time.
Vote collection export
Export vote collection results for meetings, elections, or surveys. Keep records outside the platform if needed.
PDF & payment exports
Generate PDF invoices and adhesion documents. Download bulk payment reports as CSV for your accountant.
Community analytics FAQ
Yes. The dashboard is built around configurable widgets organized into categories. You choose which metrics to display, how to group them, and in what order. You can also write custom queries to pull specific data. If the default widgets don't cover your use case, queries let you filter by date, member type, local center, or other fields.
Orgo tracks member count, growth over time, new registrations, and participant demographics. You can also build custom user lists with dynamic filtering to segment members by any criteria: location, membership type, activity level, join date, or combinations of these. Profile view tracking shows how active your community's networking is.
You can export users, roles, and contacts as CSV. Event attendance exports as CSV. Vote collection results export as CSV. Invoices and adhesion documents export as PDF. Bulk payment data downloads as CSV. All exports are available directly from the platform with no extra setup.
Orgo tracks newsletter open rates, click-through rates, and bounces. For discussions, you can see engagement metrics like reply counts and activity levels. Event attendance statistics show participation across events. Badge leaderboards show gamification activity. Together, these tell you which activities your members actually engage with.
Fee payment statistics are broken down by local center, so you can see which chapters are collecting on time. Revenue analytics let you compare periods and spot trends. You can export invoices as PDF and download bulk payment CSVs for your accounting software. The data is always up to date with what's in the platform.
Custom user lists use dynamic filtering, which means you set criteria and the list updates automatically as members match or stop matching. You can filter by any member attribute: location, membership type, join date, activity status, and more. Use these lists for targeted communications, reporting, or just to answer questions about your community.