

Where to find it
Open Analytics in the sidebar and choose the Communication tab. It sits next to Platform and Members. The tab is hidden unless all of these are true:- the analytics module is switched on;
- you clear the analytics Minimum access level;
- you hold the role set for the Communication tab. By default that is organization admins.
The figures on this tab cover the whole organization, not one chapter. Giving the
role to someone below organization admin shows them the totals, the best-time
chart and the newsletter numbers, but never the list of individual posts. The
post list names every post in the feed, private groups included, so it is for
organization admins only.
Choosing the period
The pills at the top pick 7 days, 30 days, 90 days, 12 months or a custom range (the calendar icon). A custom range can cover at most two years. Every figure on the tab is compared with the period of the same length just before it. A small arrow and a percentage show the change: an arrow up is growth and an arrow down is a fall. When the earlier period had nothing in it, any growth reads as 100%. Figures are read live and kept for five minutes. Reset cache next to the page title re-reads them straight away.The three summary cards
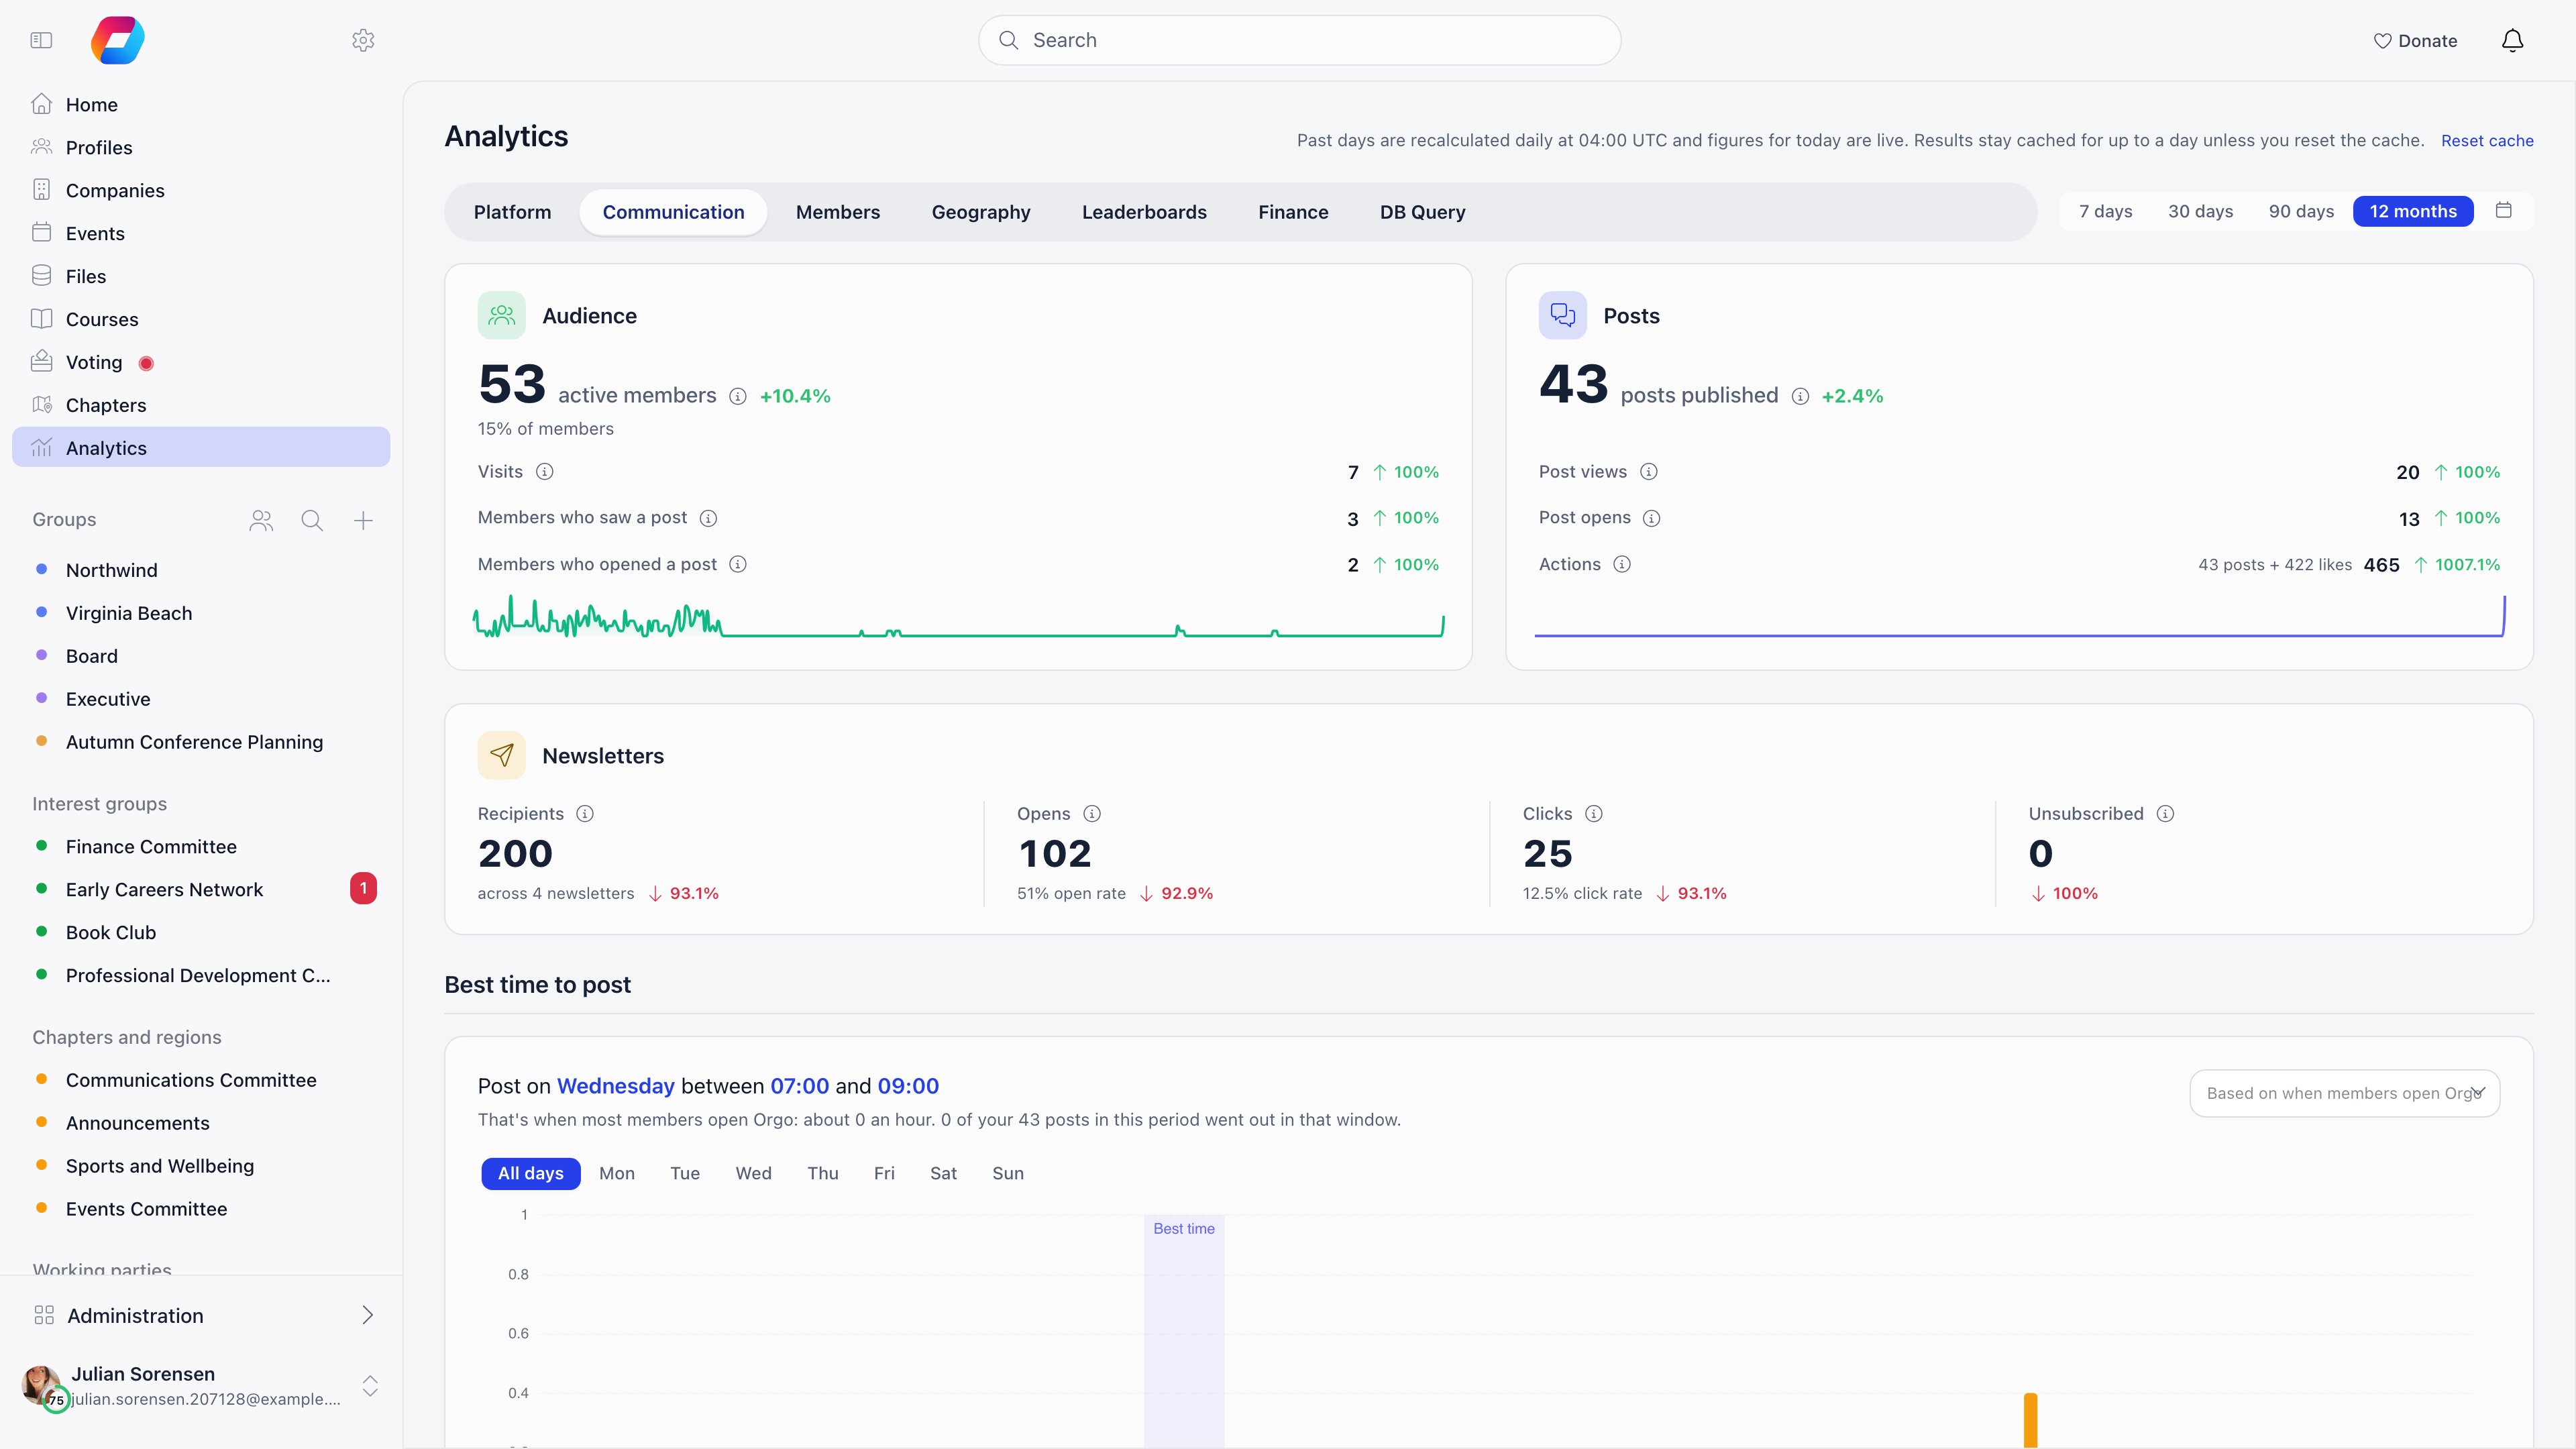
Audience
A small chart under the card shows active members for each day of the period.
Posts
A view is counted when at least half of a post card stays on screen for a full
second, once each time the card appears. Two things are never counted: a member
looking at their own post, and an administrator who is browsing as another member.
A post the member could not see in their own feed is never counted either.
Likes are every reaction on a post, whichever of the five reactions was used.
Newsletters
These are the same figures as the tiles above the campaign list in
Newsletter, added up for the period and compared with the
period before. They include every campaign of the organization, chapter campaigns
too.
Best time to post
A chart of the average week shows when your members are active, by day and by hour, in your organization’s timezone. Above it, a sentence names the busiest day and the busiest two hours, for example “Post on Tuesday between 18:00 and 20:00”, with the reason (“that’s when most members open Orgo: about 40 an hour”) and how many of your own posts in the period went out in that window. The selector beside it chooses what the chart is based on:- when members open Orgo, the default;
- when posts are seen;
- when posts are opened;
- when posts are liked.
Post results
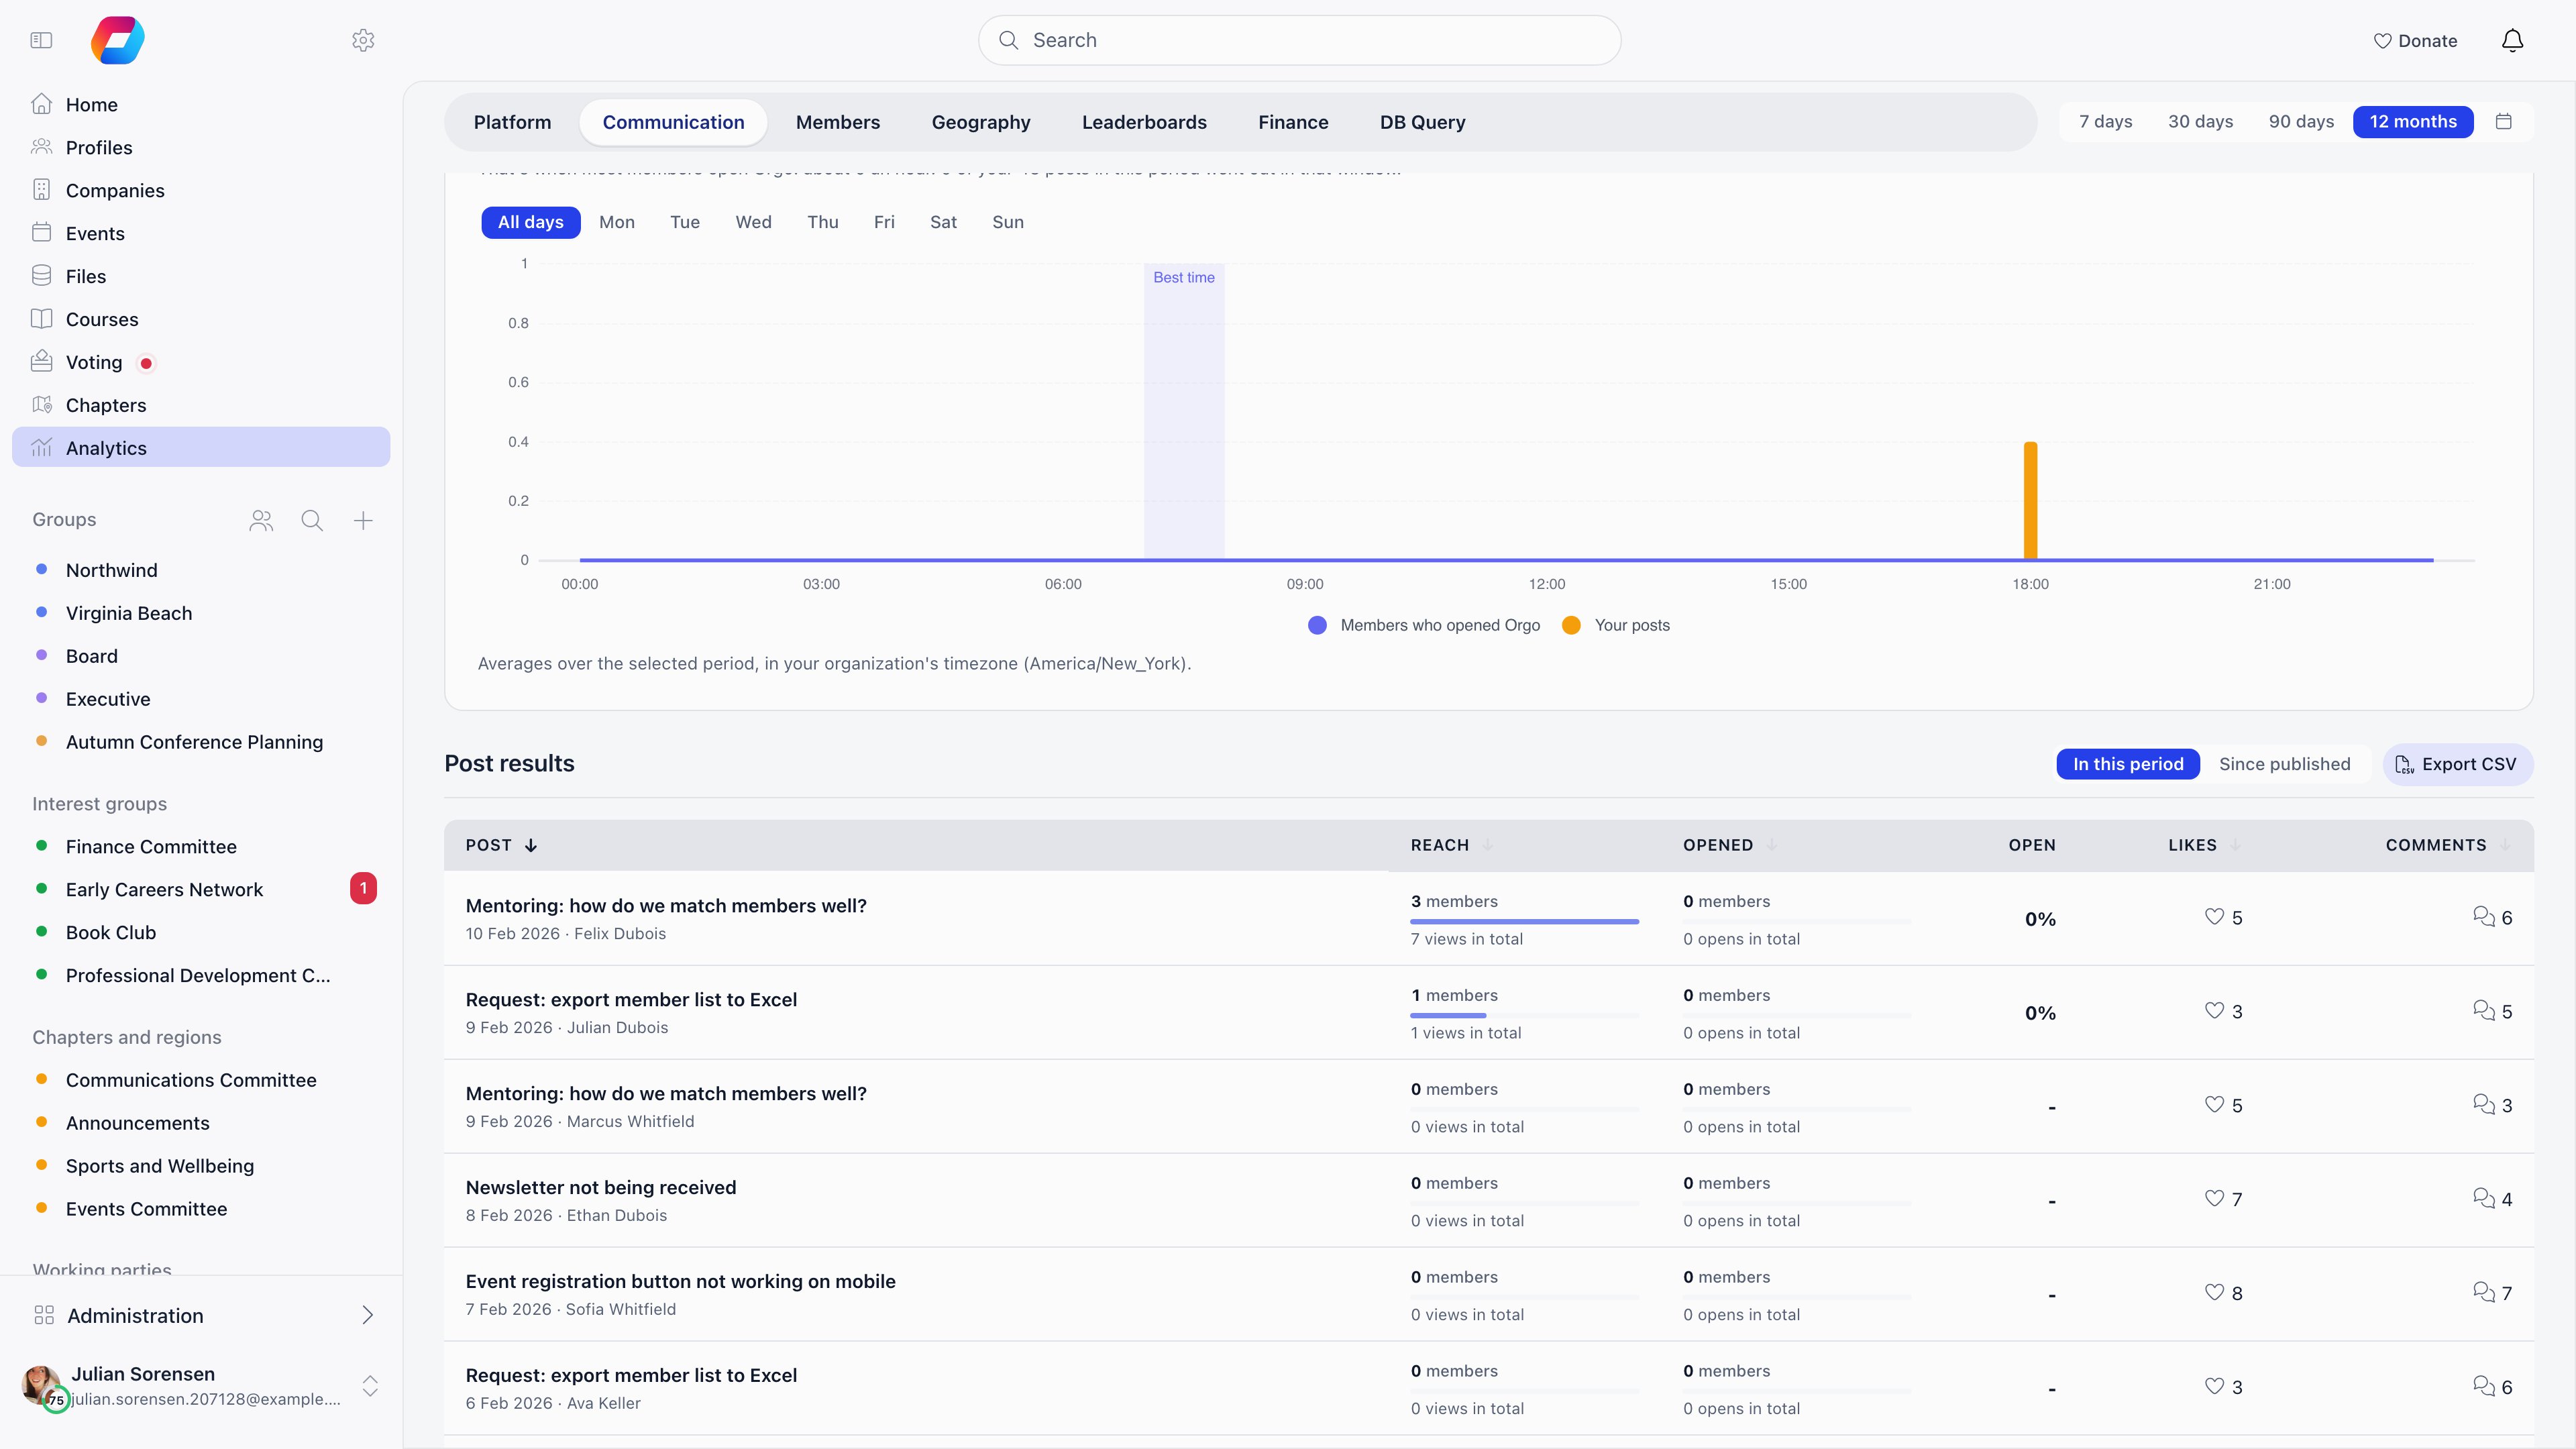
Select a column heading to sort, and select a row to open the post. The table
shows 10 posts a page. The two pills above it switch the figures between In
this period and Since published, which counts everything the post has
collected since it went up.
Export CSV downloads every post of the period in one file, with both sets of
figures side by side: the period figures and the since-published figures, each
with reach, times shown, opened by, times opened, likes and comments. The
publication time is in your organization’s timezone. Each export is recorded in
the activity log.
When the numbers start
Views, visits and repeat opens are counted only from the day Orgo released this tab to your organization. A period that starts earlier shows nothing for those figures before that day, and the chart says so when there is nothing to show yet. Active members, posts published, likes, comments and the newsletter figures come from records that already existed, so they cover the whole period.Common questions
The Communication tab is missing
The Communication tab is missing
Check the three conditions under Where to find it. The
usual cause is the role: it defaults to organization admins, and chapter
admins or communication managers do not see the tab unless an Orgo
administrator has lowered it.
Active members is much bigger than members who saw a post
Active members is much bigger than members who saw a post
That is normal. Active members counts anyone who opened Orgo at all. Many
members come for an event or their profile and never reach the feed. The gap
is a measure of how much of your audience the feed actually reaches.
A post has opens but no views
A post has opens but no views
A post can be opened from a notification, a link or the group page without
ever appearing as a card in the feed. Views come only from the feed, so such a
post shows opens with a low or empty reach.
Post views look lower than I expected
Post views look lower than I expected
A post counts as seen only when half of it stays on screen for a second, so
scrolling past quickly does not count. Your own posts and views by an
administrator browsing as someone else are left out as well.
Why is the post list missing for a colleague who has the tab?
Why is the post list missing for a colleague who has the tab?
The list shows the title of every post in the organization, including private
groups, so it is limited to organization admins even where the tab itself has
been opened to a wider role.
Related
- Insights & Ask Orgo for the other Analytics tabs and for asking questions in plain language
- Newsletter for the campaign reports behind the newsletter card
- Discussions for the posts, comments and reactions this tab measures
- Permissions for the Orgo administrator flag and the roles used above